With the 2013 Wimbledon Championships just around the corner, I thought I’d take this opportunity to explore how Andy Murray exposed Roger Federer’s backhand in last year’s Olympic final on centre court at SW19.
Analysts claim that if Federer has one weakness it’s his backhand. But what is the most effective way to draw an error on the Federer backhand? Some say it is to force Federer to hit his one handed backhand above shoulder height. Whilst this may be true, as we have seen against Rafael Nadal many times there may be other ways to beat the Federer backhand.
Data from the Gold Medal Olympic match shows there is potential to draw a high error rate on Federer’s backhand by moving him backward into the shot.
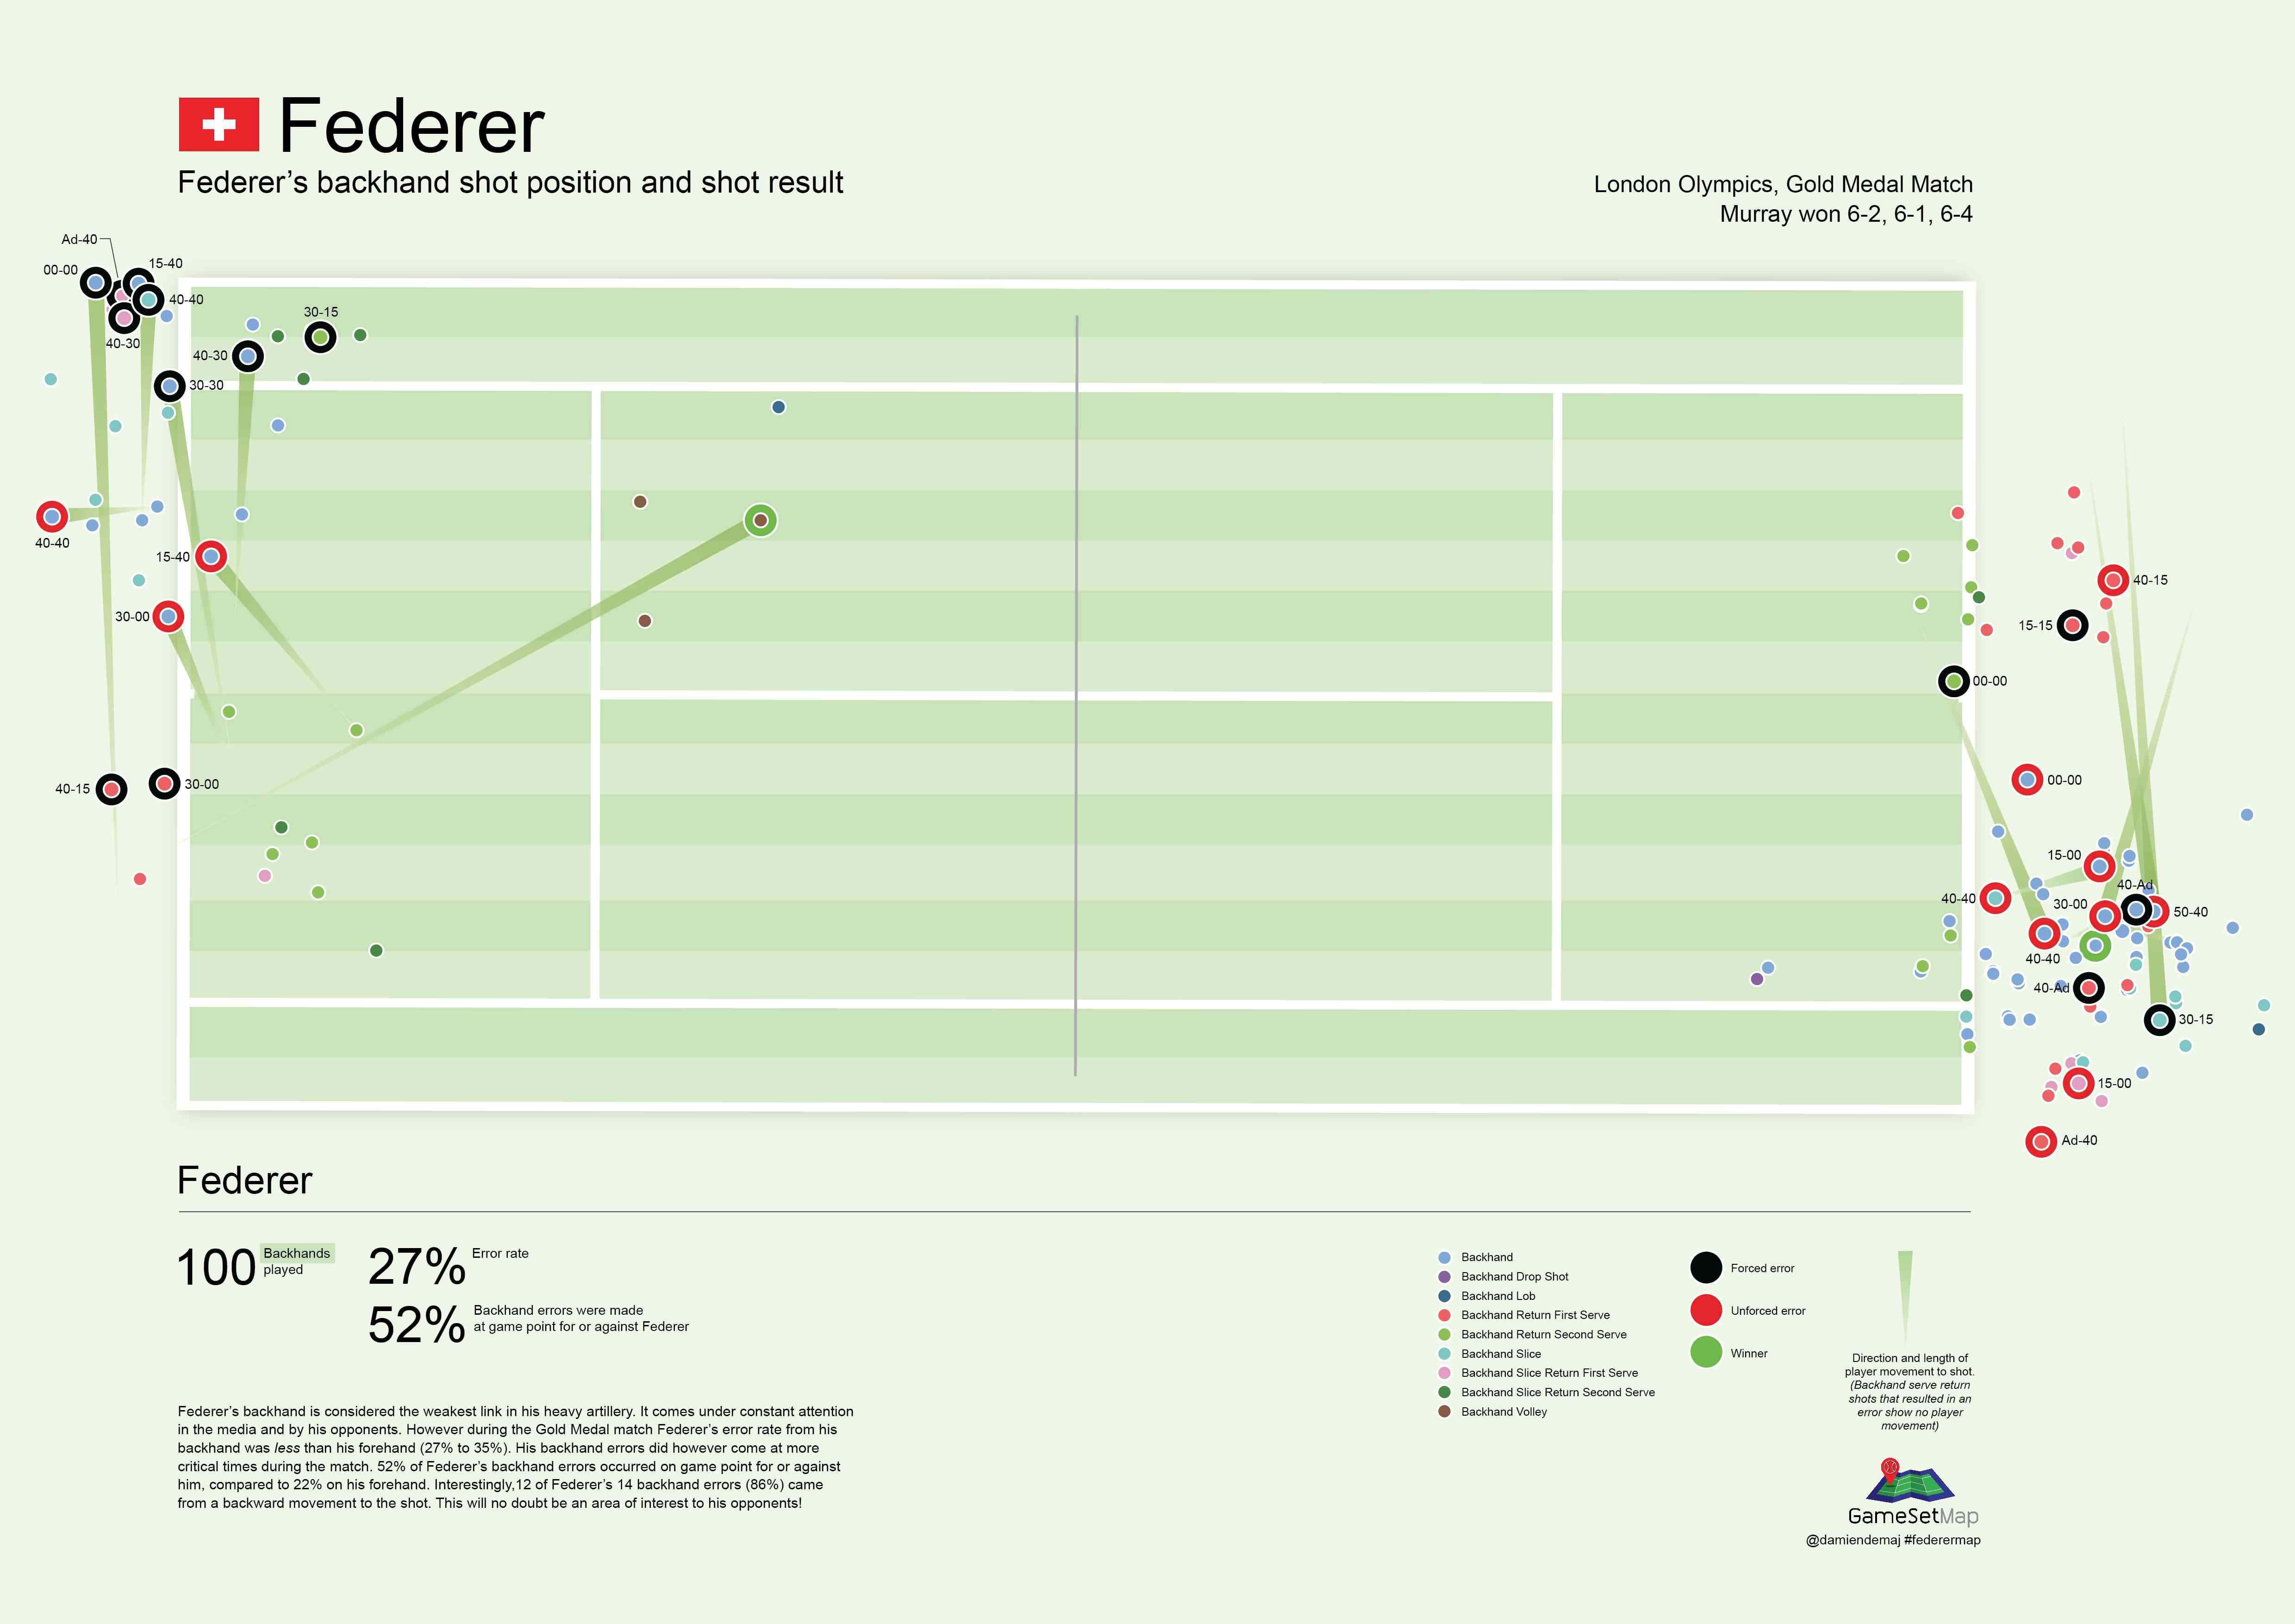 Mapping Federer’s backhands. The green swooshes indicate Federer’s movement to a backhand error or success. (Click image to enlarge).
Backward Movement to the Shot
We know that the direction and length a player must cover from their previous shot has a significant influence on the player’s next shot. In order to better understand the Federer backhand I plotted a vector of his movement to each shot (from his previous shot location). The map above shows his movement to a backhand error or outright success from his backhand. We can see from the map that 12 of Federer’s 14 backhand errors (86%) came from a backward movement to the shot. Some of the movement vectors are clearly more ‘backward’ in direction than others, but in any case there is a pattern here that may warrant further investigation. The length of movement to each error on his backhand varies from half a court to only a few steps.
Time: Success at important points wins you matches!
With a little more digging we can see further patterns emerging in the data. The map shows us that 52% of Federer’s backhand errors occurred on game point for or against him, compared to 22% on his forehand. To see this pattern a little clearer I labeled each of his errors with a time stamp, indicating when each of his errors (and winners) was made.
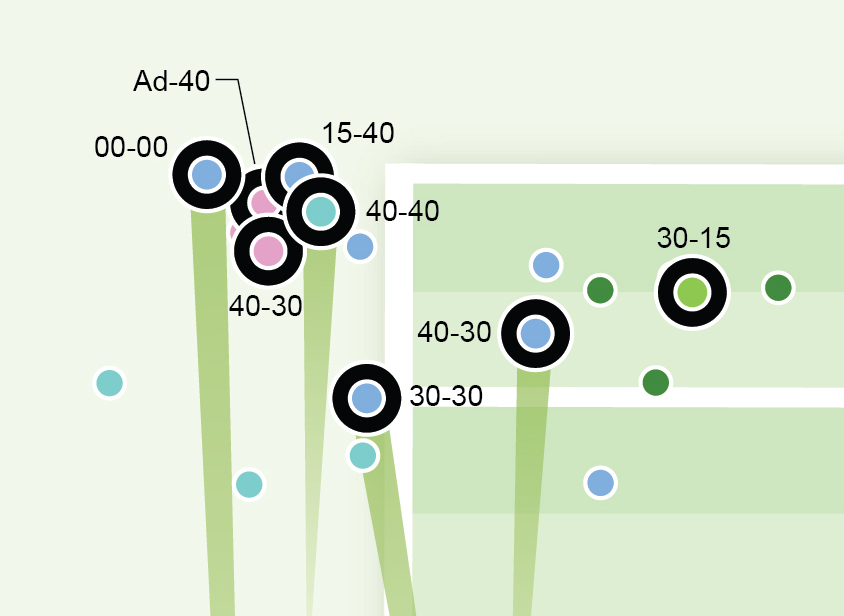 Adding a time stamp annotation to the map (like Ad-40, 15-40) allows us to understand the temporal component of Federer’s shot making tendencies.
The data from the match suggests that Federer is more likely to make an error at an important point on his backhand than his forehand. Perhaps his opponents at Wimbledon this year might want to take note of this!
Visual Exploration of Spatial Data
GameSetMap is always searching for new ways to visually explore the spatial component of tennis and I hope you agree that this infographic of Federer’s backhand begins to the lay the foundations of a potentially interesting story, a story that perhaps tells us a little more about how to draw an error on Federer’s backhand, and when to attack his backhand.
Examples like this are just the tip of the iceberg. We have much work to do in sports analytics for tennis, but hopefully this example and others like it ignite further work and discussions about what’s possible with spatial tennis data!
Notes: As discussed in my earlier research there are other spatial components that could be integrated into the map that could potentially help improve the analysis and strengthen the argument. Clearly the speed and spin on the ball are other important variables that if available would further enhance the story.
I’m always happy when I see a new post to your blog.
Did you get your data from the match by watching it and creating the database or was the data available somewhere?
(I just got ArcGIS for Desktop. It’s been awhile so still in tutorial-mode. )