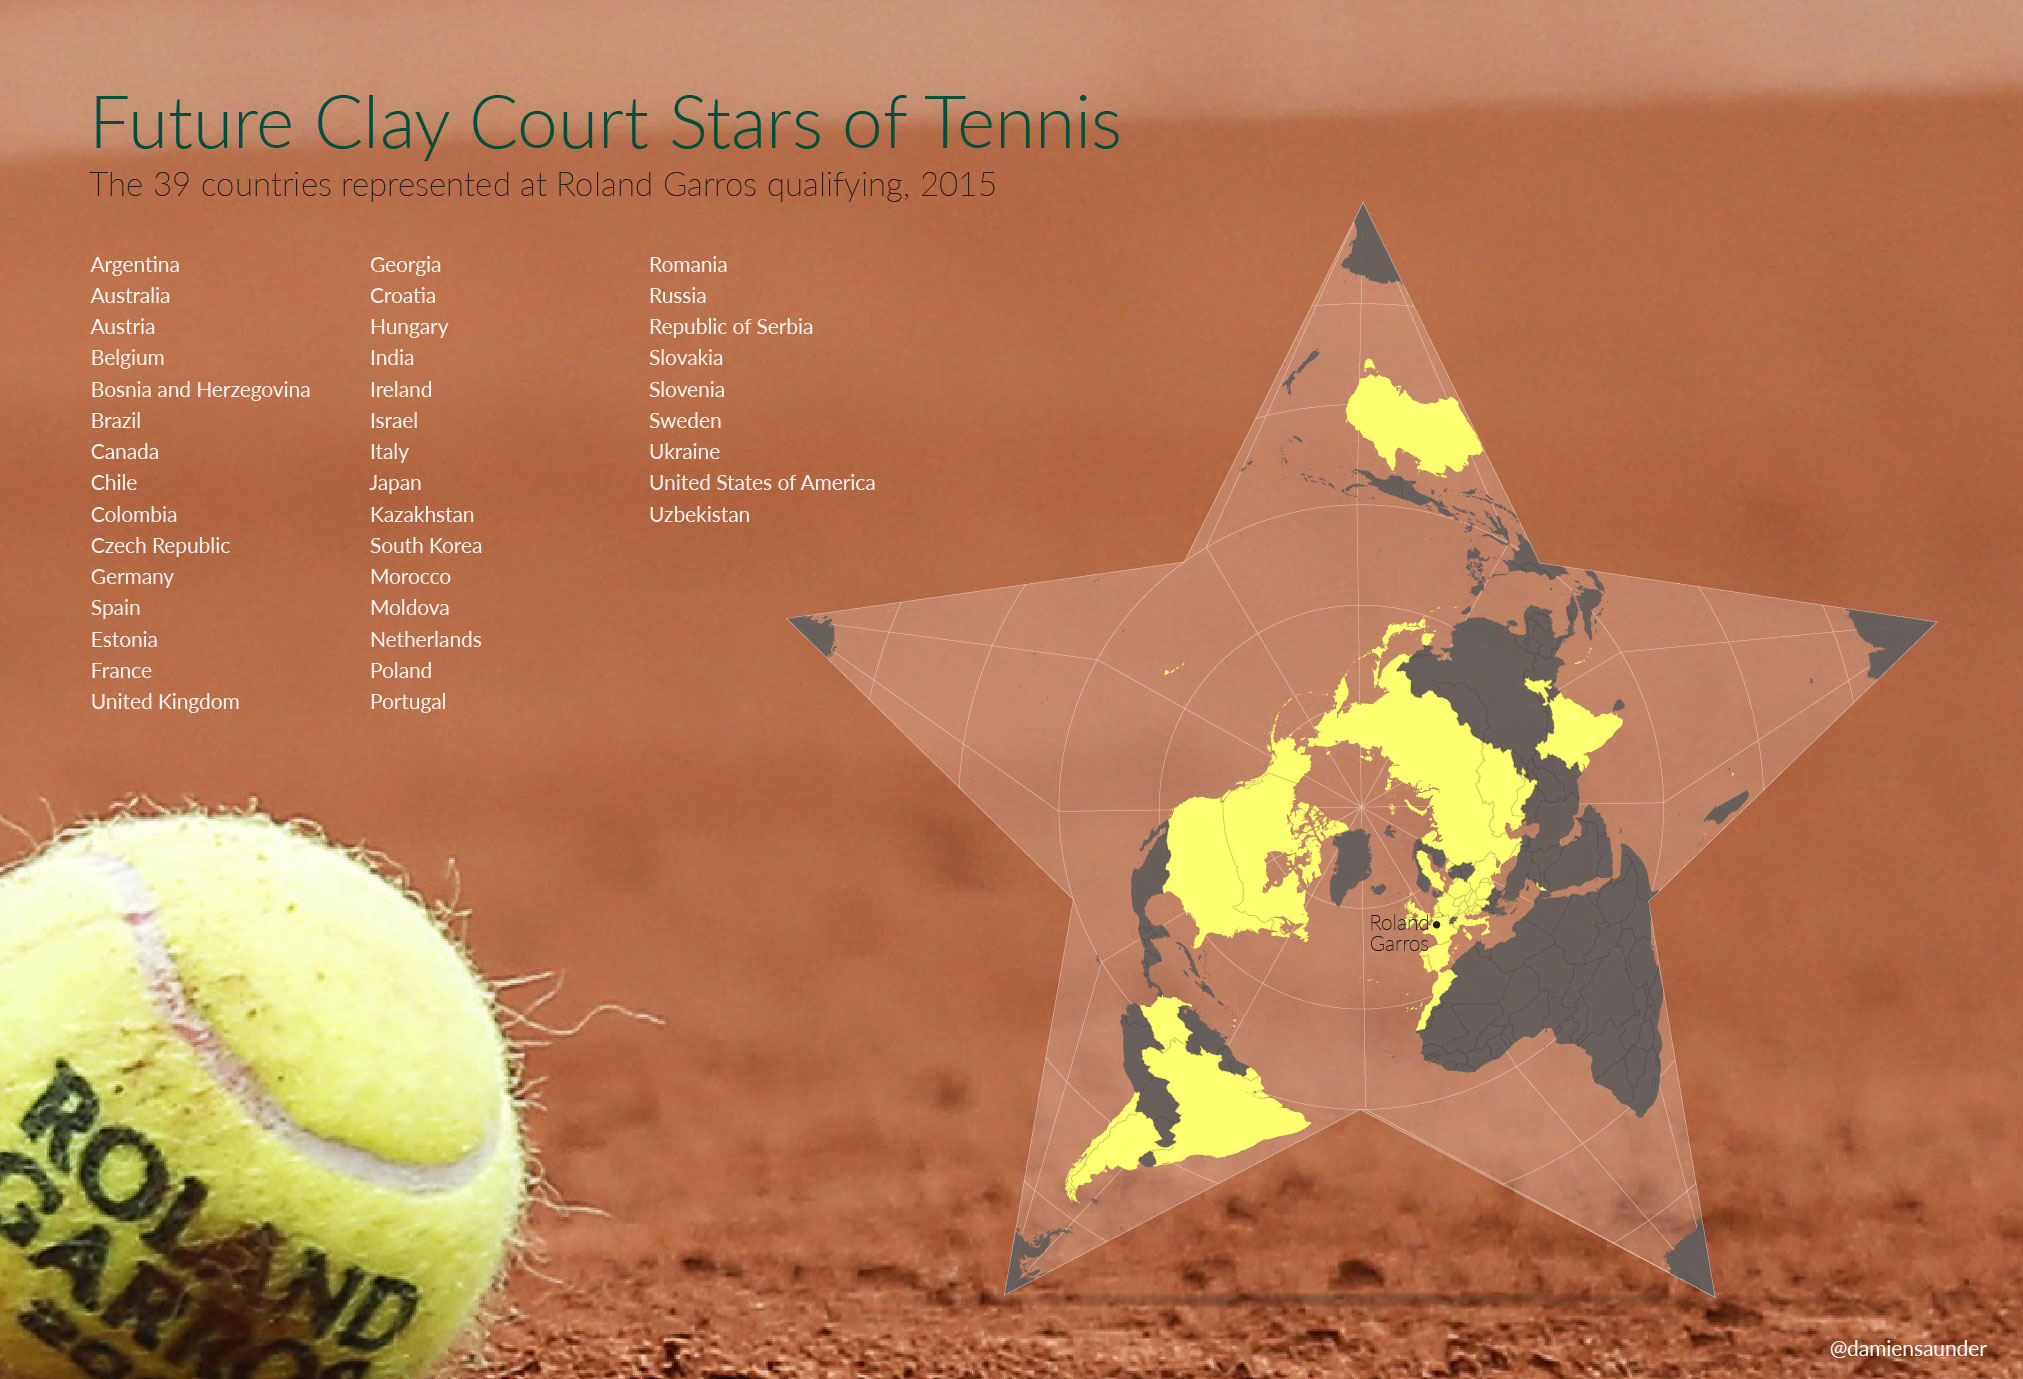
Earlier today Josh Meiseles who writes for the ATP World Tour tweeted some pretty interesting stats about the players who were about to kick off their qualifying campaign for Roland Garros. He said that there were 39 countries represented at the Roland Garros qualifying (1 less than last year). I figured it was worth mapping the 39 countries to see where all of the players were coming from (see below).
To create the map I joined up the list of countries that Josh supplied to a country database and then chose a suitable projection to visualise the 39 countries. Since these young players are up and coming future stars I decided to use a Berghaus Star projection. The Berghaus Star projection does exactly what its name suggests. It projects the world’s surface onto a star shape. The Berghaus Star projection was created in 1879 and is perfect for this type of world projection. I also wanted to make sure Roland Garros (Paris) was near the center of the map since it is the focal point of the story. The map is centred on the north pole with Europe and North America dominating the centre of the projection (since that’s where the majority of tennis players who were playing in qualifying come from). Areas highlighted yellow indicate the countries participating in the qualifying.
There’s a huge opportunity in tennis (and all sports) to integrate media stories with maps. So much of the game and its players is about location, like this story was. And it is far more visually stimulating to see the facts presented this way than perhaps in a table or simply in writing. Maps draw an audience, they fascinate people and as a result they drive traffic to stories.
We hope you enjoy this media map. We’ll keep an eye out for further opportunities as the season rolls out over Summer.

