ATP World Tour Interactive Map – 2014

With the 2014 ATP World Tour underway in Brisbane, Doha and Chennai this week, I thought I would put together a quick interactive map that locates this year’s 61 tournaments around the world. The ATP World Tour map allows fans to follow the world’s greatest players around the world as they battle it out in 2014.

ATP World Tour Map 2014

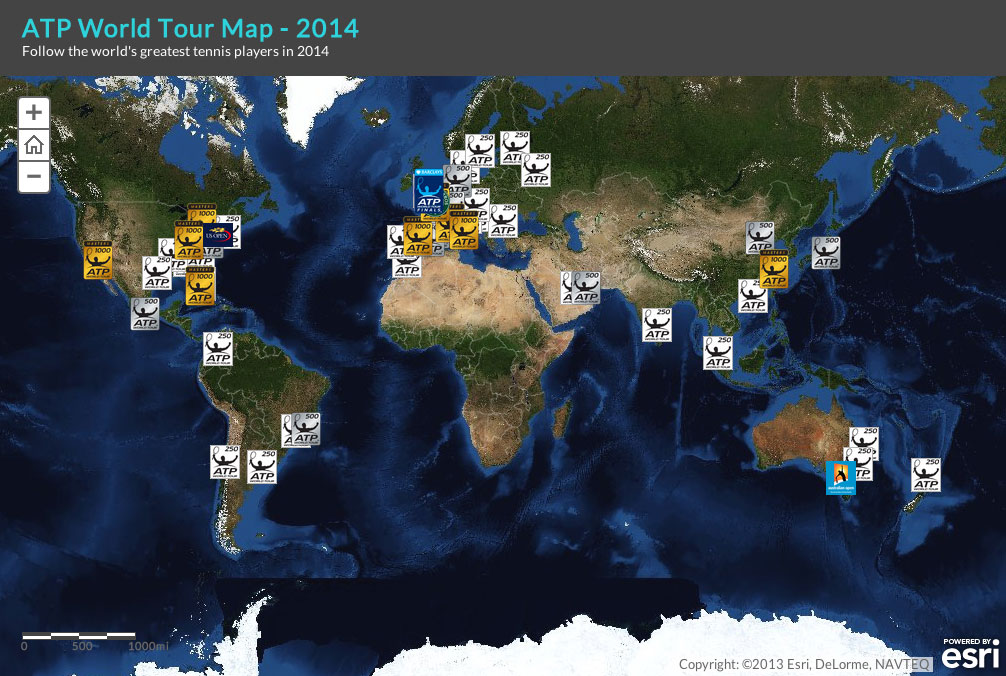
The ATP World Tour Map – 2014. Click here to access the map.

The map shows the location of the four Grand Slam tournaments, the nine Masters 1000’s, the eleven 500 and the forty 250 series tournaments, as well as the season ending World Tour Finals played in London.

Use the map to check out the site of the newest tournament on the tour this year, The Rio 500 in Brazil. Remind yourself of where the clay tournament in Umag (Croatia) is played. A tournament that returns to the circuit this year after a one year absence. Check out the latest stop in China in 2014 at the Shenzhen Open, a city that is already familiar with the women on the WTA tour.

Explore each tournament in more detail by clicking on each of the icons to reveal further information about the tournament like the prize money on offer, who is the defending champion, what the tournament surface is and other important information.

ATP World Tour Map Wimbledon
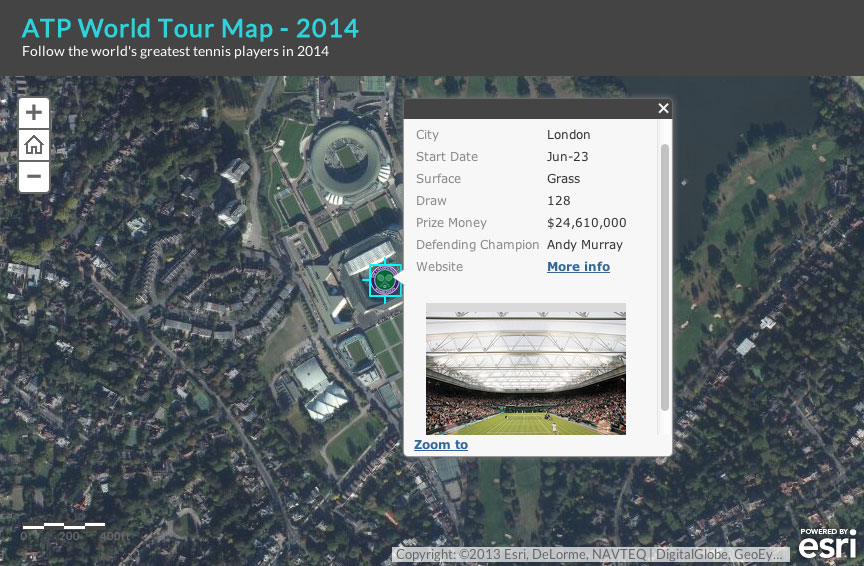
Interact with each tournament to reveal important statistics about each event.

The map features some of the highest resolution available satellite imagery of the globe, meaning you can see the tournaments up close like never before. Click on the “Zoom To” link in the pop-up to quickly navigate to each tournament. You will find yourself being blown away by some of the global landscapes that sit at the doorstep of some of the lesser known tournaments, like the Credit Agricole Suisse Open.

Gstaad Tournament
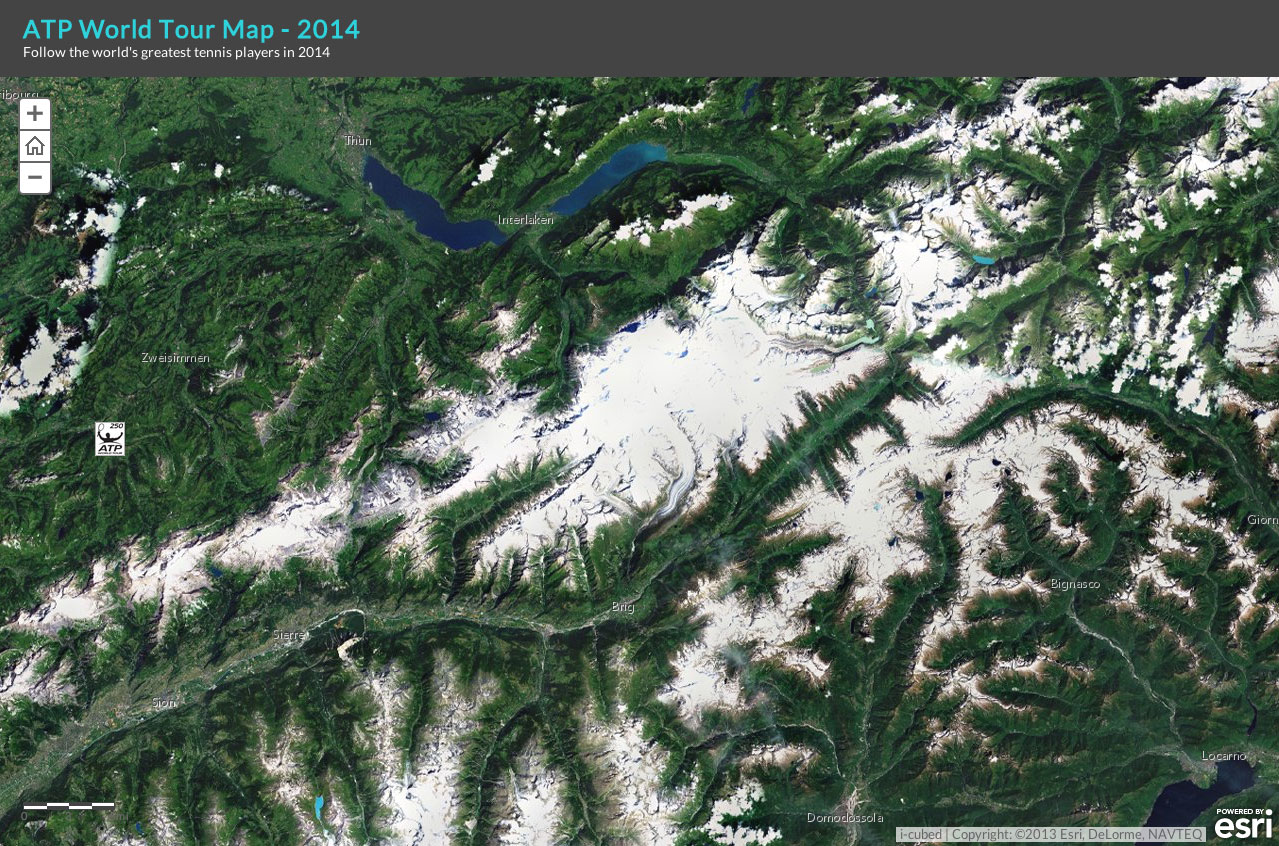
The 250 series Credit Agricole Suisse Open, set against the backdrop of the beautiful Swiss Alps.

Valencia Open

Discover the Valencia Open 500 (Spain) played at the stunning Ciutat de les Arts i les Ciències where Mikhail Youzhny triumphed in 2013.

In each of the pop-up’s there is a link to the official tournament website where you can see who’s down to play in 2014, and where you can get tickets. I hope you have fun exploring the map throughout the year, and I hope it inspires you to plot your next tennis adventure!

Read the ATP press release about the 2014 tour here.

To view the full 2014 ATP World Tour calendar in PDF format, click here.

Where are you most likely to win a point on Nadal’s serve?

A couple of weeks back I released an interactive Game Tree of Nadal’s stellar 2013 season. The Game Tree was an experimental infographic that mapped Nadal’s service dominance, and showed us his most common path to victory.

Nadal Game Tree

Nadal’s Game Tree captured the imagination of many for its originality and groundbreaking way of visualizing tennis games. 

The flow lines through the original game tree (above) allow us to see some interesting patterns emerging from his 666 service games.

Using the data from the flow lines, I developed the Proportional Symbol Game Tree (see below). It maps the chances an opponent has of winning a point on Nadal’s serve.

Nadal Proportional Symbol mapA Proportional Symbol Game Tree. Mapping the chances an opponent has of winning a point on Nadal’s serve. <click to enlarge>

Below I’ll talk you through a few interesting observations I’ve made about the Proportional Symbol Game Tree. If you see other patterns, and would like to share them drop a comment at the bottom of the page!

The Bad News (for Nadal’s opponents).

The bad news for Nadal’s opponents is that your best chance at winning a point on his serve is at best, only half a chance! 15-15, 0-30, 30-15 and 30-0 are where your best chances are of taking a point from Nadal on his serve. But even at these points, the data tells us that Nadal’s opponents are on average likely to win only 1 in every 2 (0.5) points. Of these points, 30-15 is your absolute best chance of winning a point, representing a 1 in 1.8 chance (0.56), which is hardly encouraging!

The story only get’s worse…

You might as well head to the chair when you get Nadal to Deuce. You have virtually no chance of winning the game from Deuce onwards (see the smallest circle on the proportional symbol diagram above). Nadal dominates his opponents at Deuce more than any other point. He teases his opponents by going back-and-forth between 40-Ad and Ad-40, but according to his 666 service games, he only gives his opponents 1 in 5 chance (0.2) of winning the game from Deuce onwards. OK, so heading for the chair at Deuce might be slightly over doing it, but you had better step up your game big time at Deuce otherwise Nadal will be notching up another game on serve!

If you’re lucky enough to score the first point on Nadal’s serve then history shows that he pulls out all punches to prevent the score line from going to 0-30. The 0-15 point is a clear turning point in the game tree. However if you can get to 0-30 on Nadal’s serve then you are back in with half a chance to take him to 0-40!

The far right bottom three points (40-30, 40-15 and 40-0) indicate that once Nadal get’s a sniff of the finish line, he makes sure he closes it out.  From this position his opponent only ever has on average 1 in 3.3 (0.3) chance of pegging him back to Deuce.

Interestingly at the most important points in each game (15-30, 30-30, 15-40, 30-40 and Deuce) Nadal gives you a very small window of opportunity compared to other points in the game tree. At Deuce we know he dominates, but he’s not putting the hammer down quite as much as expected at these big points.

Summary

Nadal’s 2013 season was historic – no doubt. He rarely lost any games on serve. In fact he won 88% of his 666 service games that we studied.  Apart from the Deuce point there is little variation between the chances his opponents have of winning a point on his serve (0.35 to 0.55). His brutal consistency is clearly evident in these figures, and in the above graphic. The variable scaling of the circles in the Proportional Symbol Game Tree allows us to easily identify opponents areas of opportunity (even if they are only half chances)!

So it’s now off to the video tape and other supplemental tennis stats to see what Nadal is consistently doing at Deuce that makes him so dominant!

—-

Source: Nadal’s Game Tree. The Game Tree app is coded so we can plug it into any ATP, WTA or Challenger event. Let us know who you’d like to see mapped next!

Original data source: William Hill

References: C. Morris, “The most important points in tennis”, In Optimal Strategies in Sports, vol 5 in Studies and Management Science and Systems, , North-Holland Publishing, Amsterdam, pp. 131-140, 1977.