Game tree: the unstoppable Novak Djokovic

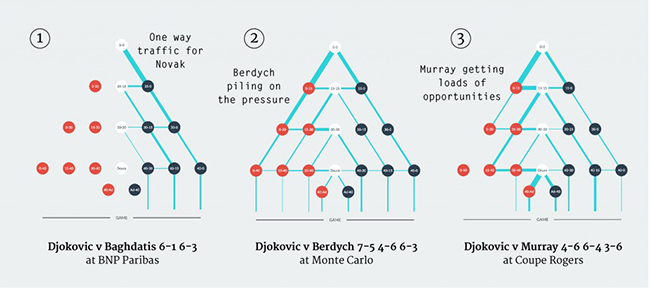
The digital content team at the Australian Open contacted me late last year to write a few articles for ausopen.com. The first article (published on the 24th Jan) is a celebration of Novak Djokovic’s 2015 season titled “Game tree: the unstoppable Novak Djokovic“. The article uses our innovative game tree to better understand how dominate Novak was on his 1,033 service games in 2015.

To view the article click here:

Game TreeWe also highlighted some of Novak’s more interesting matches throughout the year (see below):

Game Tree

I encourage you to use the interactive game tree to take a deeper dive into some of Novak’s classic matches last year and to see what might have been for some of his closest rivals, as they begin their assault to dethrone the undisputed 2015 king of men’s tennis.

Read the full article here.

Rafa Nadal Academy Map

Rafa Nadal Academy Map

Rafa Nadal Academy Map

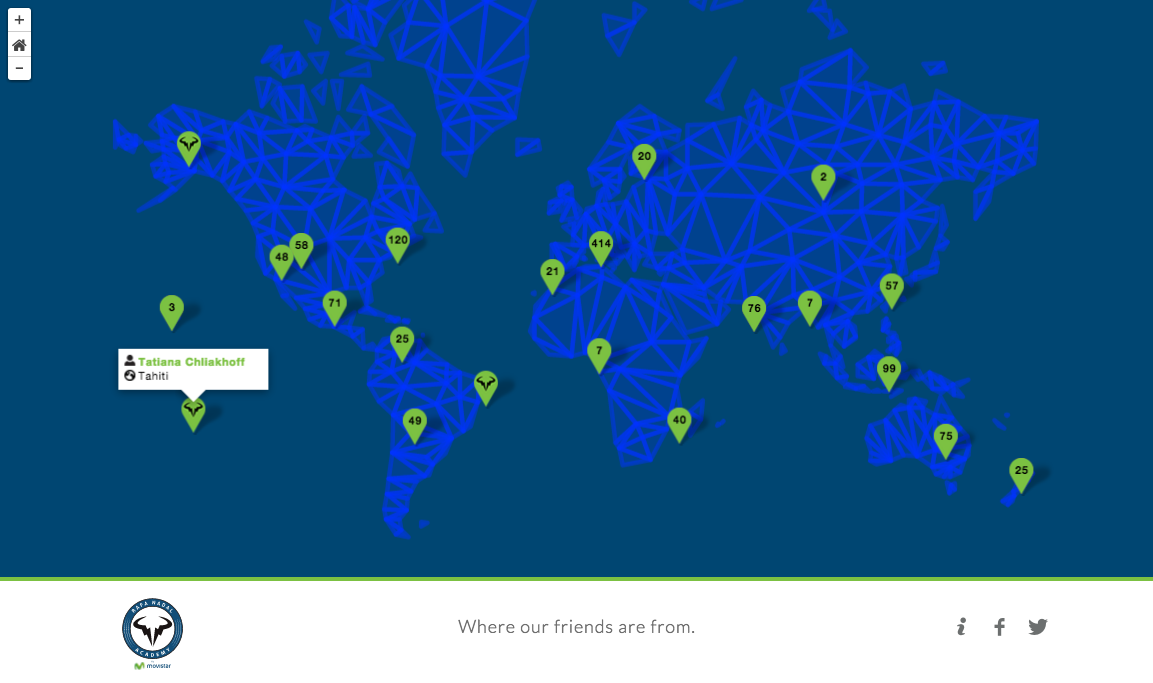
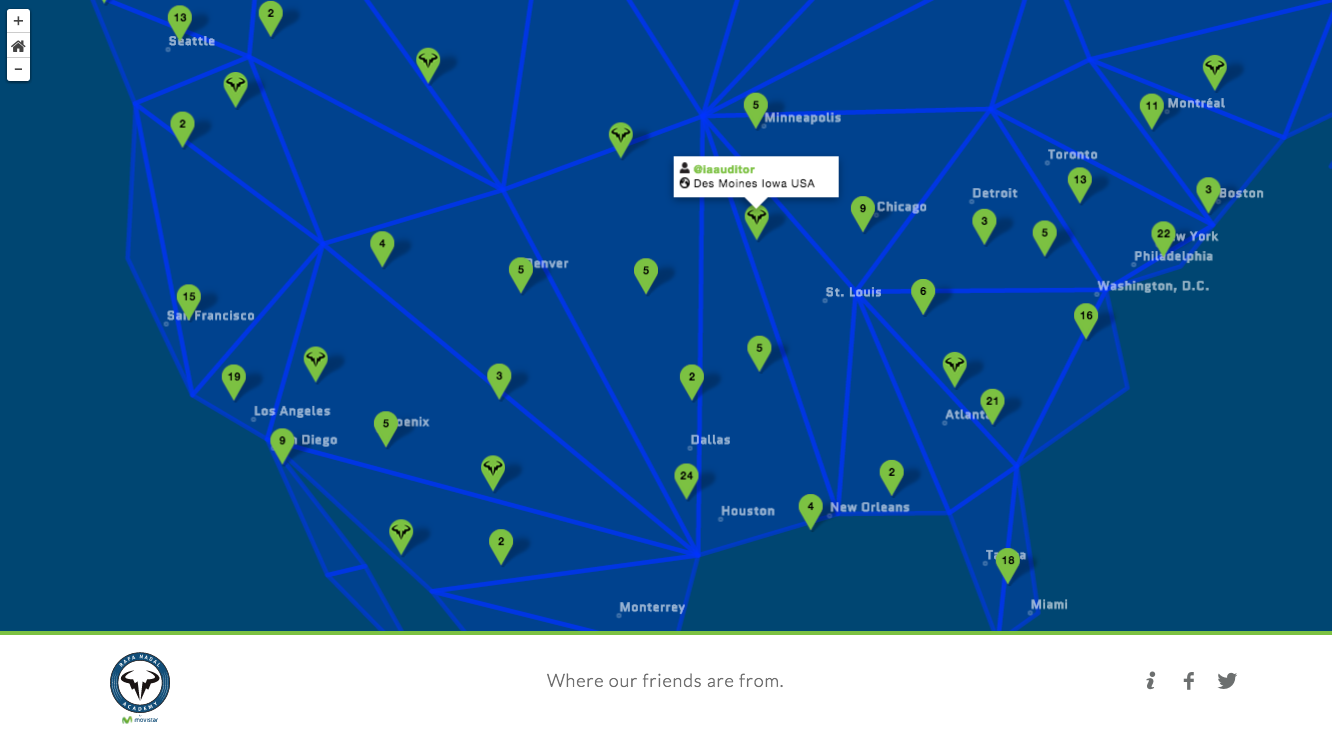
On December 2nd, 2015 Rafa Nadal’s Academy asked their social media friends to share their location with the academy so they could create a map that showed off their global network of support. Over 1,000 of their friends responded via Twitter and Facebook and here we present the location of those 1,000+ friends. The academy commissioned GameSetMap to design and build the interactive map. View the map here.

Building a Pair of Christmas Trees from Hawk-Eye Data

I want to send out a big thanks to everyone who has shown interest in what is going on at GameSetMap this year. 2014 has been a busy year, and the last couple of months have been super exciting. More news to follow about that in the New Year…

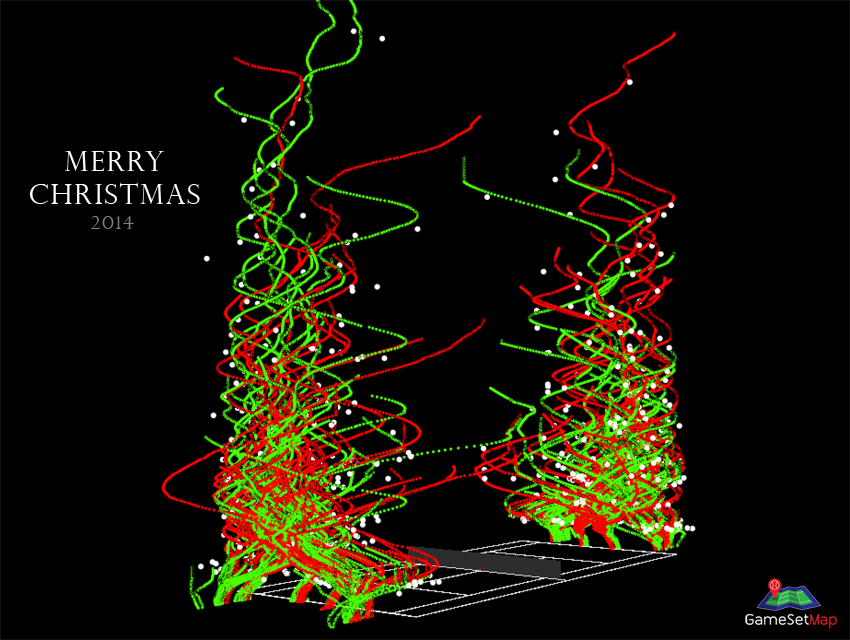
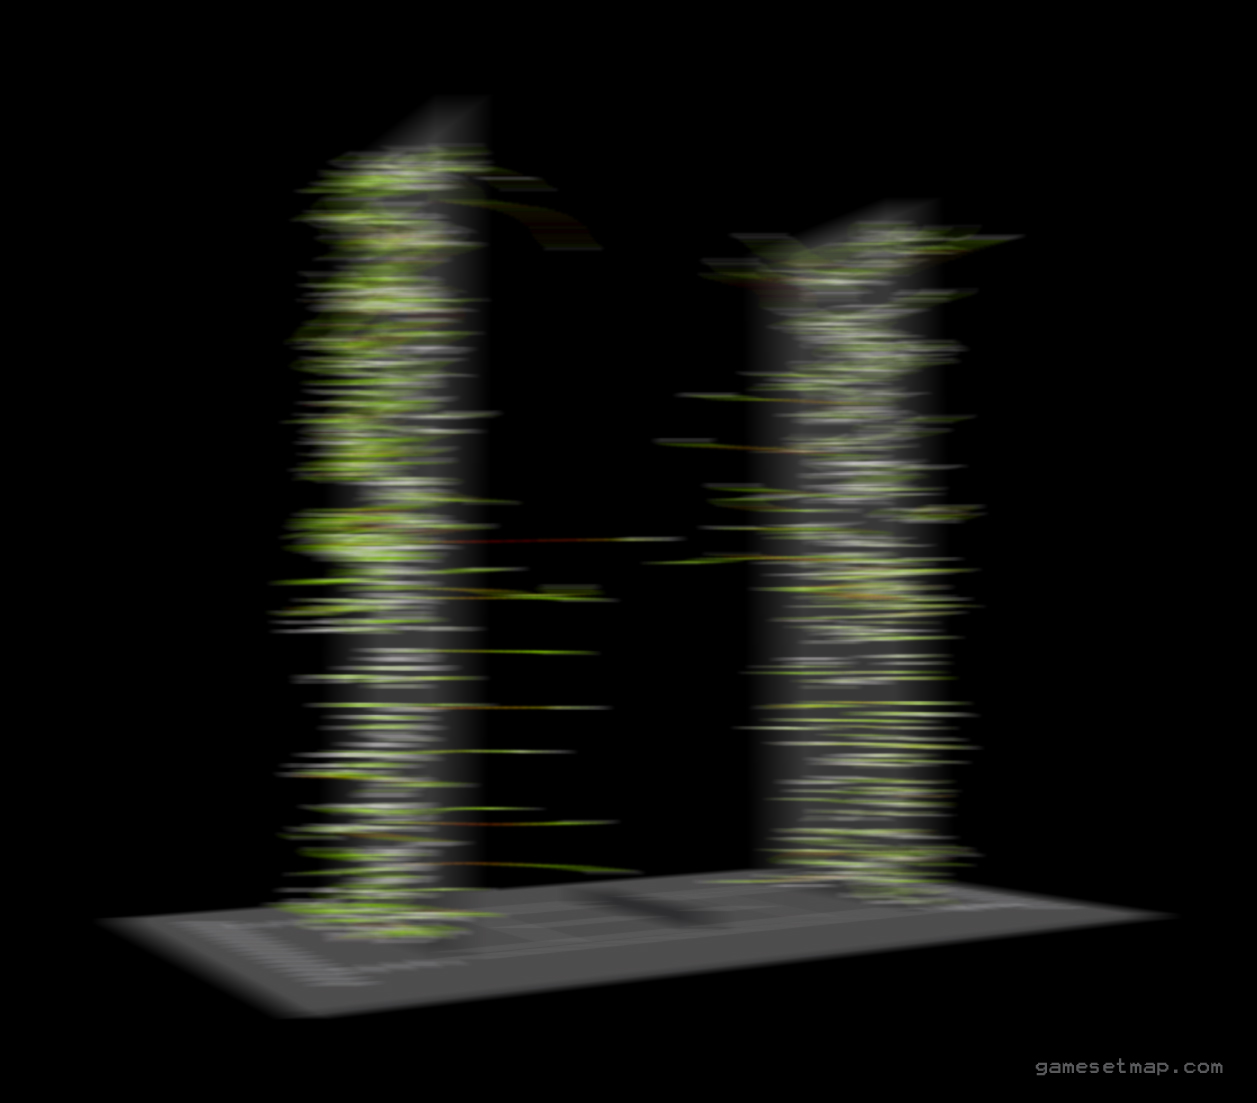
But for now I wanted to send all of you tennis lovers a christmas card made out of Hawk-Eye data! Just because I could!!

Hawk-Eye Data Christmas CardIt’s just a little bit of fun using player movement paths (the red and green lines) and player strike locations (the white points) from a match I was analysing recently. It was an attempt at creating a pair of Christmas Trees from the data. Kind of worked don’t you think?

Once again thanks for the support in 2014 and I look forward to sharing more insights into the wonderful world of geo tennis analytics!

Damien

Official WTA finals app likely to open up a can of worms

Today the Women’s Tennis Association (WTA) and SAP announced the launch of the official WTA Finals mobile app just in time for the BNP Paribas WTA Finals in Singapore – press release.

WTA Official AppThe app has been in progress for much of 2015 so I was happy to finally see SAP and WTA deliver on their promise of “taking the fan experience to the next level.”

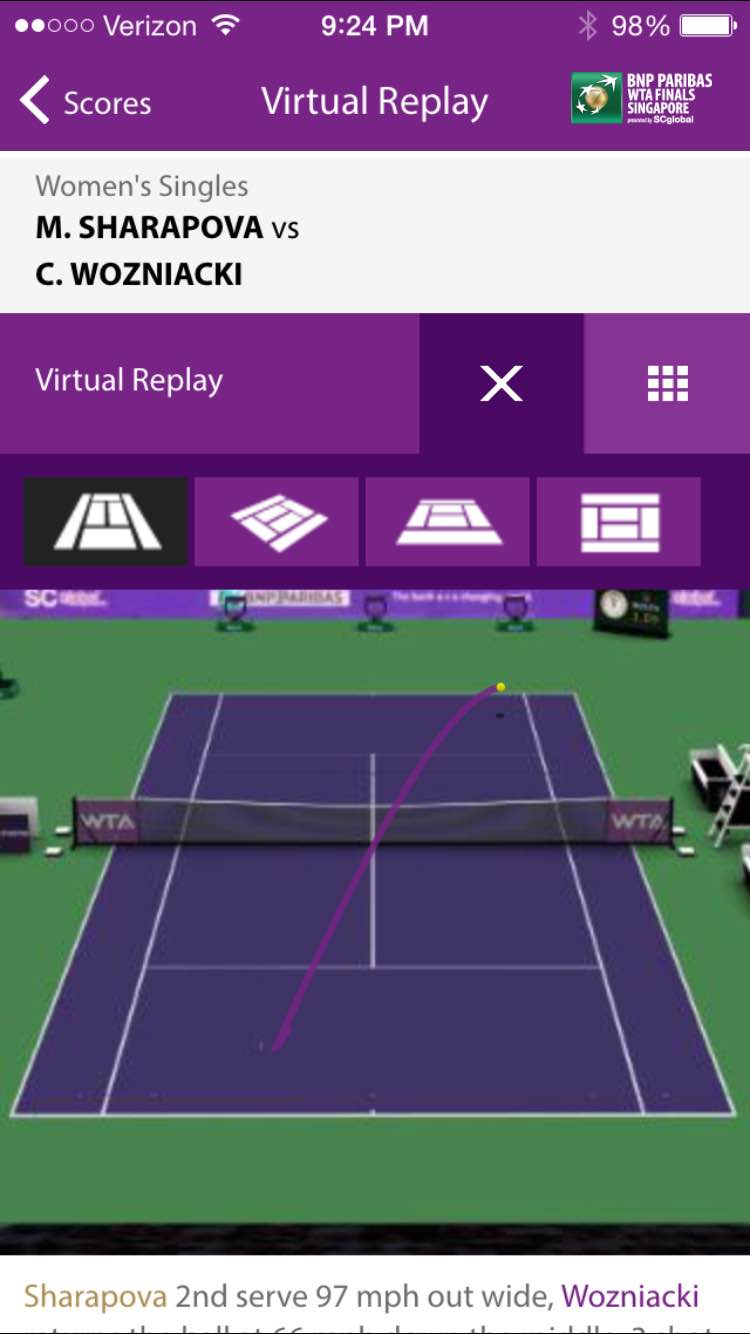
The app has all the usual features of a tennis app; live scores, news and videos, schedules, draws etc. But what makes this app “groundbreaking” is a feature called Virtual Replay where users can watch an animated point-by-point replay of the match unfolding right before their very eyes. It’s kind of cool to watch the ball trajectory animate over the net between the players (for what it’s worth). Unfortunately it’s not clear which player is playing at which end as the animation runs through. You will need to read the commentary of the point from below the animation to figure that out.

WTA Virtual Replay

The default view of the animation is a normal camera view (from one end of the court) but users have the ability to change the view to 3 other camera angles which is a nice touch.

IMG_0184

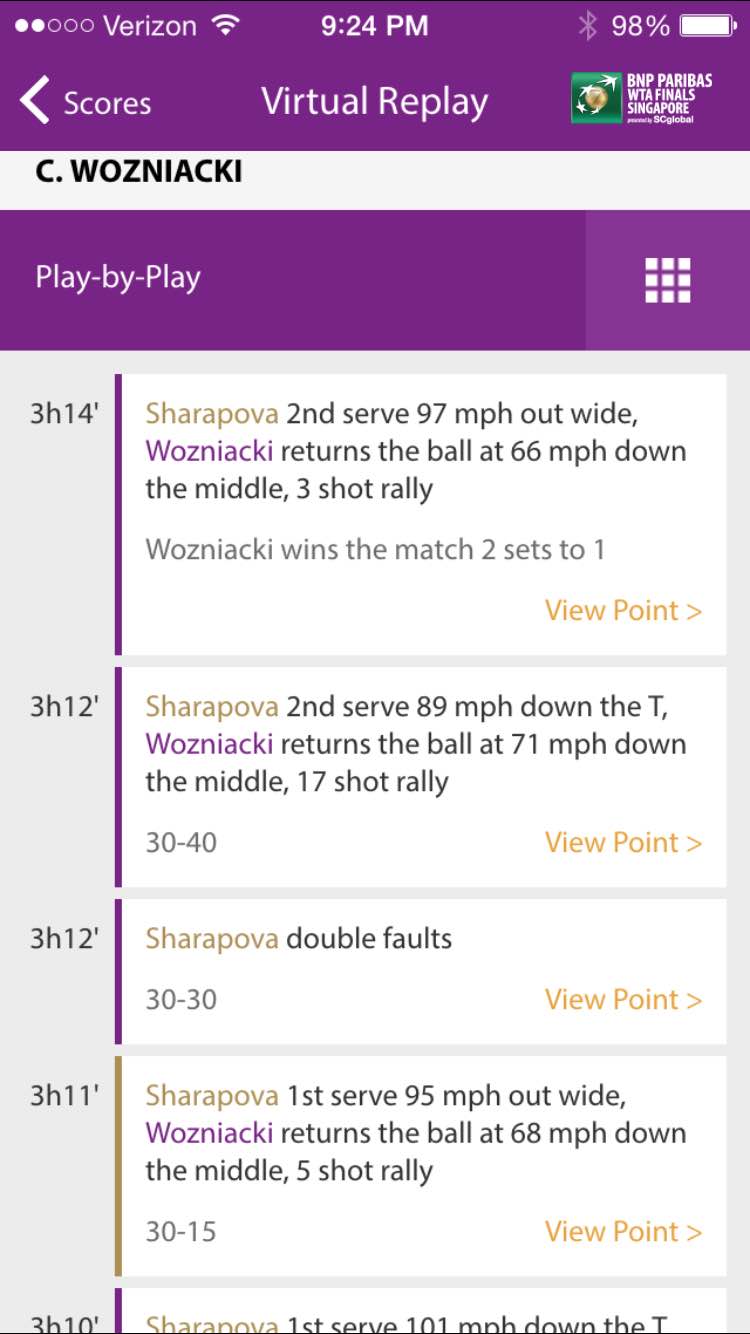
Users can then choose which point they want to watch from the point-by-point breakdown, which is a neatly organized commentary of each point from the match showing the point score, and key actions made by each player.

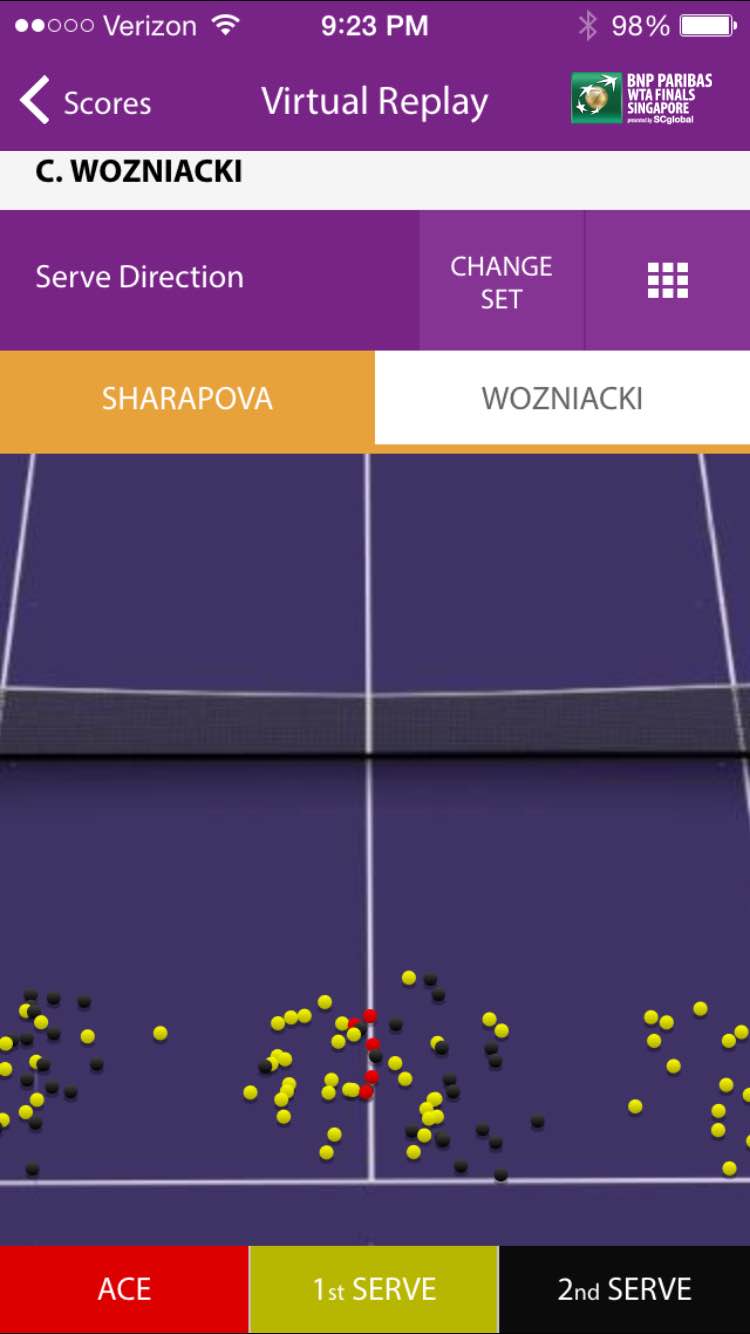
The app also includes additional visualisations like Serve Direction (below).

IMG_0180

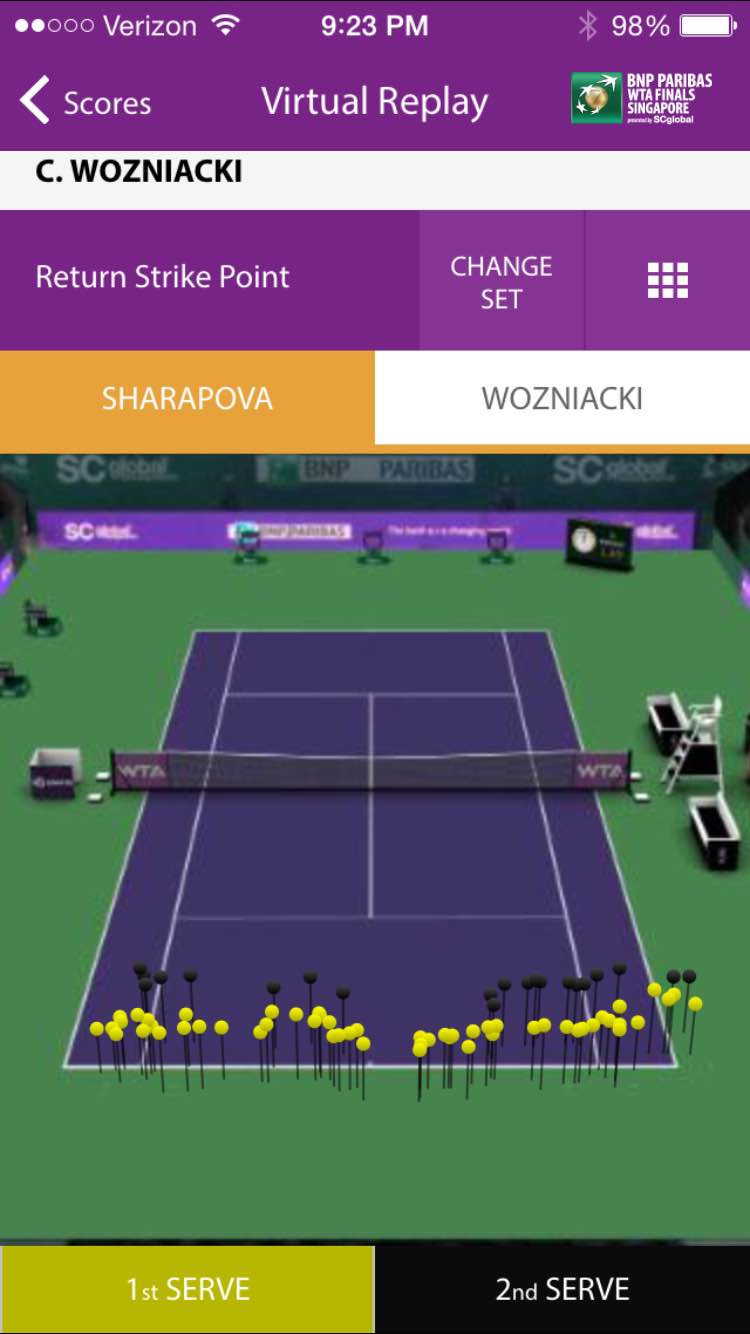
Return Strike Points

WTA App

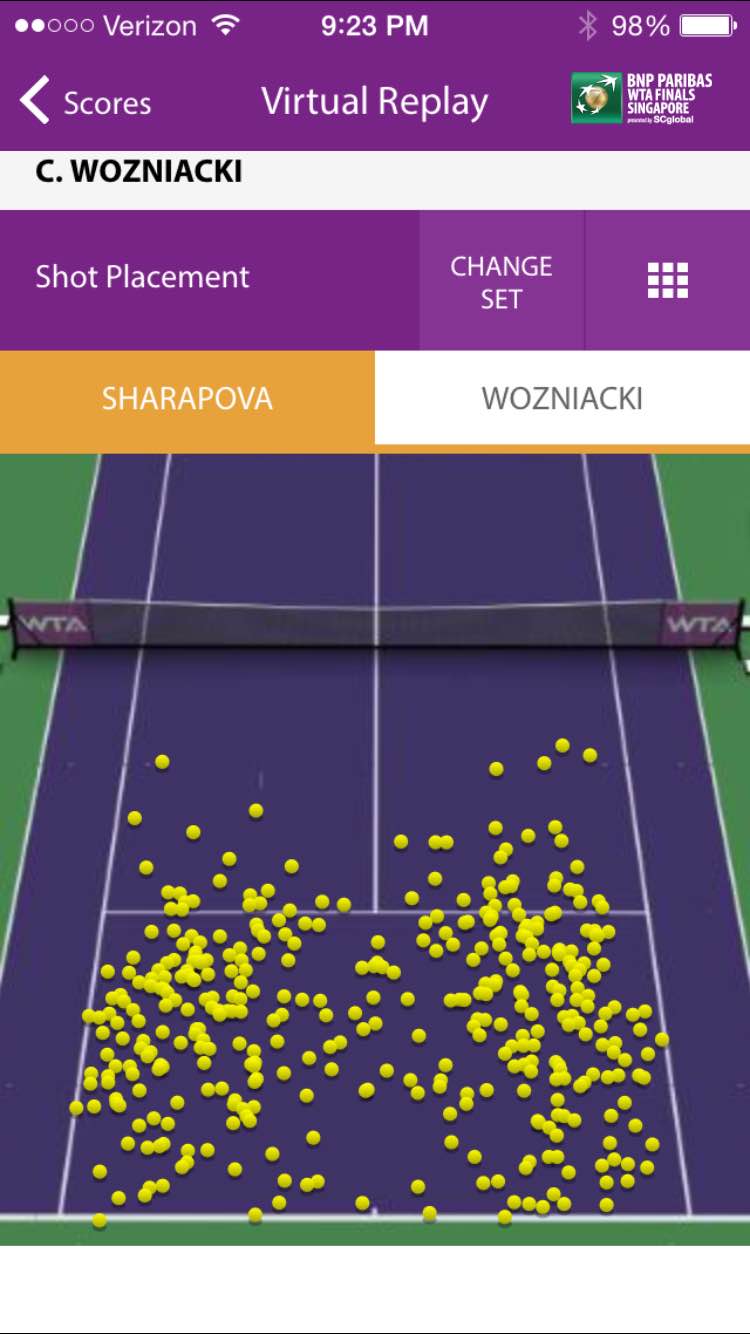
Shot Placement

WTA Shot Placement

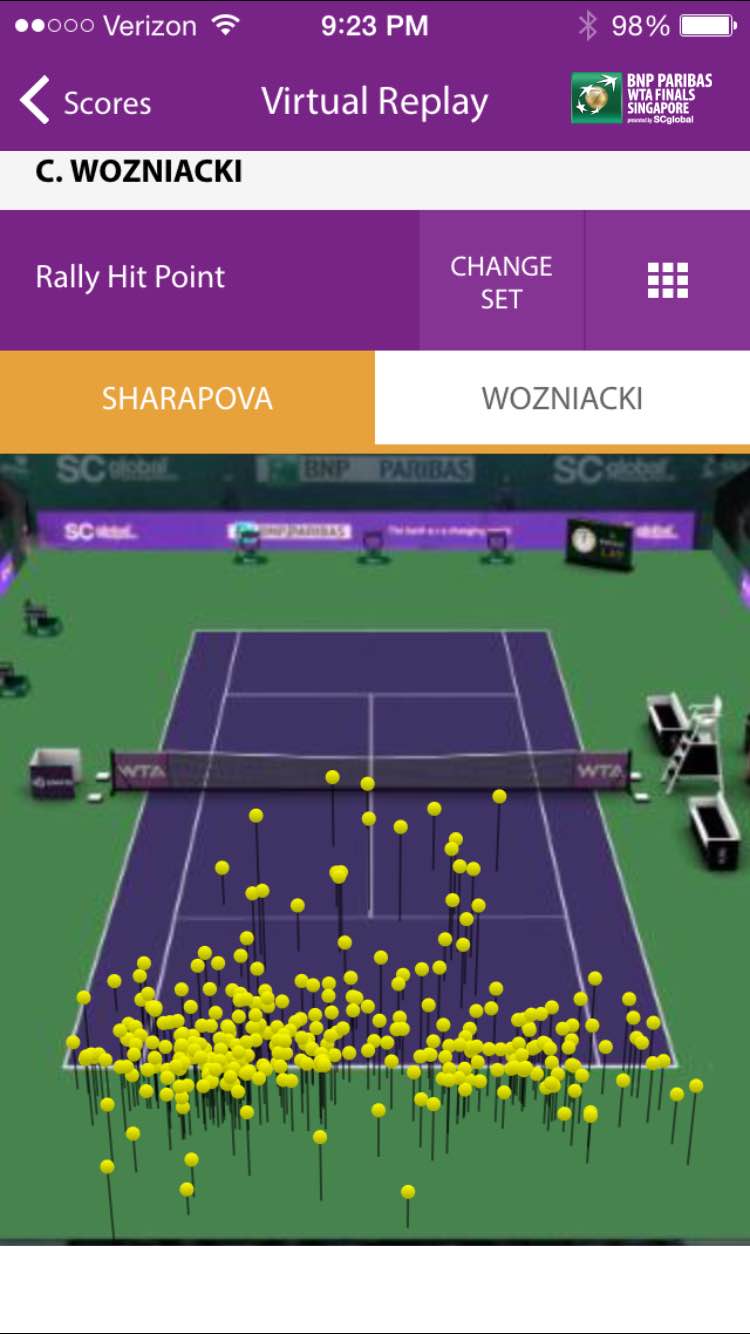
Rally Hit Point

WTA App

All of the visualizations allow you to switch between players, and you can change the Set you want to view at any time. It all makes for a very impressive mobile application, and is certainly light years ahead of any other tennis app I have seen. It is also no mean feat to package all of this content up in a very usable, and engaging mobile app that fans are sure to love and embrace.

So how useful is all of this? Well, to be honest we’ve kind of seen it all before. Hawk-Eye through their various relationships with TV Broadcasters like ESPN and the BBC have been publishing these types of visualizations for a number of years. Admittedly we have not had access to this level of information post match and in the palm of our hand before, so this is new ground definitely. But we are not really seeing anything new here.

The visualizations in the app unfortunately lack some valuable context in order to make them really useful for players, coaches and the fans. For example they are simply static representations of the data. You can’t query them (by touch), or filter them, or overlay one player’s points on another in order to perform any additional analysis. There is no significance attached to the data, like winners, unforced errors, big point plays etc. There is no way of knowing whether the patterns we see are expected, or a cause for alarm given the sate of the match, or past performances against this player. Perhaps we’ll see this kind of contextual information added in future releases. SAP and the WTA claim they have worked closely with the players to develop the app to their needs. However my feeling is most astute coaches and players will see these visualizations as nothing more than eye candy (for now).

As a tennis fan, and analyst of the game, the application naturally left me wanting more, and I suspect coaches and players will feel the same. What the WTA has effectively done is open up a big can of worms. The visualizations in the app leave so many questions unanswered, which is not untypical of a all-in-one app like this. But it does provide a wonderful insight into the potential of these kinds of visualizations. In order for players to really benefit from the true potential of this rich dataset from Hawk-Eye they are likely to still undertake independent analysis which dives much deeper in geographic patterns and tendencies than what we see here.

Hats off to the WTA for leading the way with this new-age tennis app. It has raised the bar and expectation going forward, and it definitely takes the mobile fan experience to a new level. I look forward to hearing what the players and coaches really think. My understanding is they will be given a more comprehensive app for on-court coaching, which may pack a few more tricks than what we see here. That may or may not be a good thing given visualisations like these tend to take time to digest, assess, and decide what action to take. This will be a new challenge for coaches, particularly in the heat of the battle. My sense is this kind of information will be primarily used post-match when emotions and the tension from a match have passed. It will also be interesting to see how the ATP respond over the coming months/years. Perhaps they too will partner with SAP to deliver a similar app for the mens tour if this takes off.

The WTA application was tested on an iPhone 6.

How to bend it like Federer

Roger Federer claimed his 23rd ATP World Tour 1000 Masters title on the weekend by beating Gilles Simon 7-6(6), 7-6(2) in Shanghai. Whilst this wasn’t Federer’s most memorable match of his career, he was able to get the job done when it mattered most. However, the match that everyone is still talking about is his semi-final win over Novak Djokovic. For it was Federer that turned back the clock by putting on a masterclass of serve and volleying.

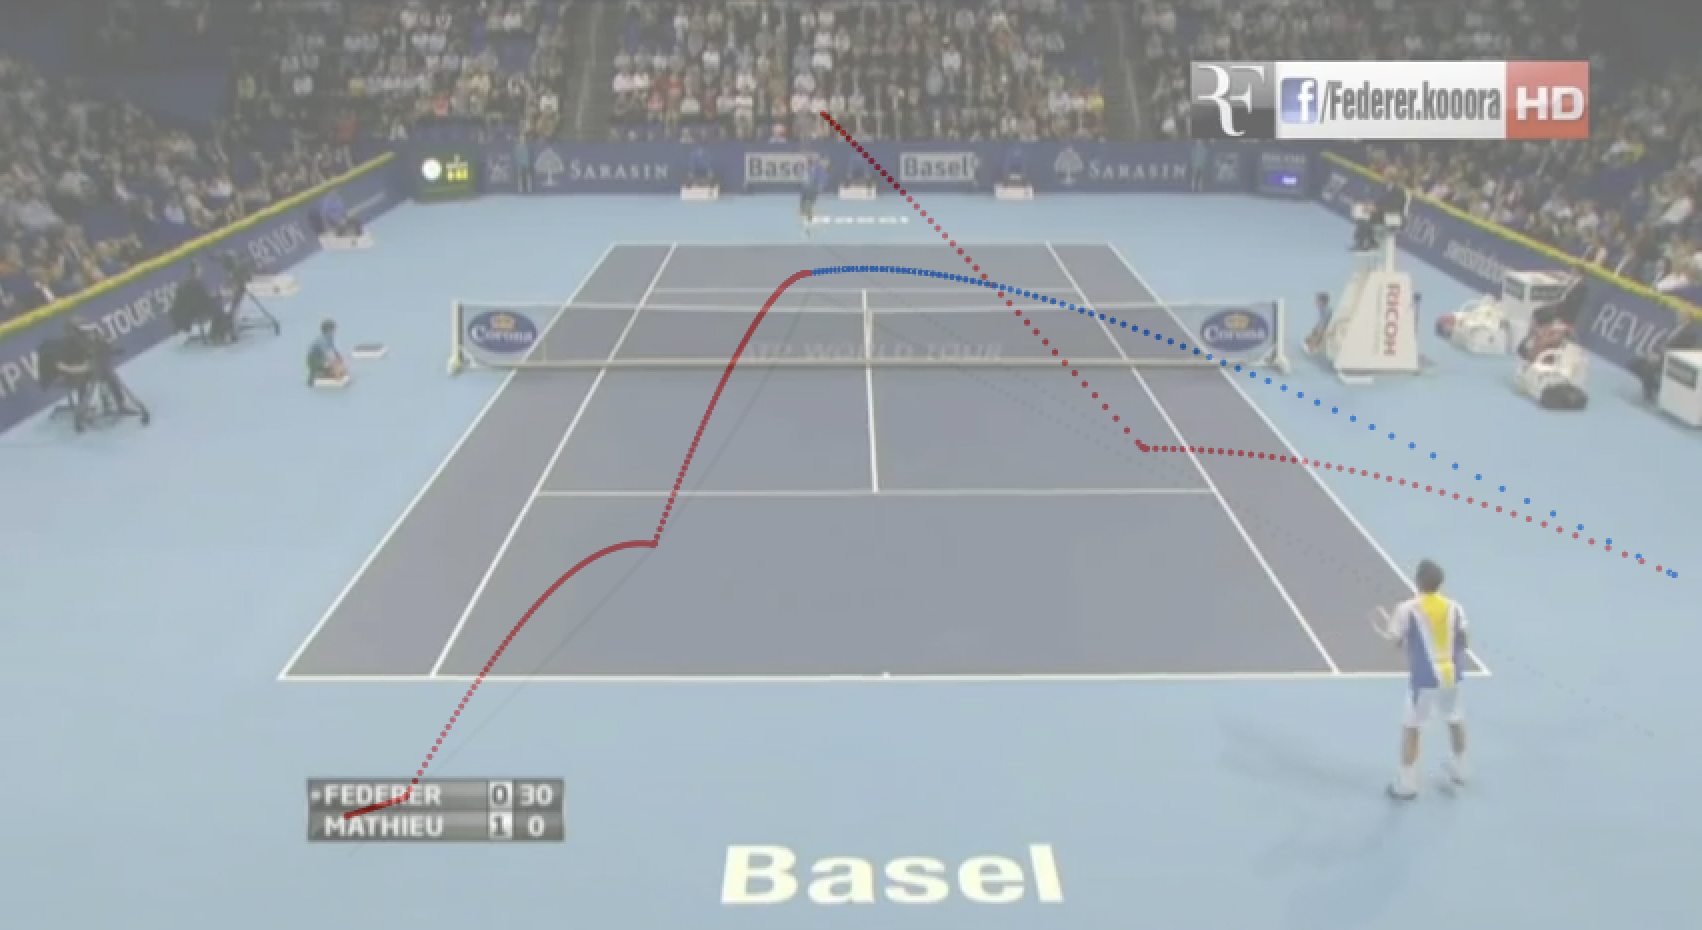
Last night I pulled down some Hawk-Eye data from a match Federer played against Paul-Henri Mathieu back in 2012 at the Swiss Indoors. I ran a quick visualisation of a serve and volley point played by Federer to illustrate how Federer sets up his serve and volley points using a beautifully executed slice serve.

Federer Hawk-Eye Serve

Figure 1: Federer v Paul Henri Mathieu, Swiss Indoors, 2012. Federer serving. Red lines are Federer. Blue line is Mathieu’s return of serve. Click to enlarge.

In this example Federer slices his serve out wide to Mathieu’s forehand, drawing Mathieu off court. Mathieu picks up the Federer serve (very well actually) and returns it right at Federer’s feet. Unfortunately for Mathieu, Federer makes a rather tricky half court volley look seemingly easily as he punches the Mathieu return into the open court to finish off the point.

Federer Hawk-Eye visualisationFigure 2: Mathieu’s look off of the Federer racket. The red lines are Federer. Blue line is Mathieu serve return. Click to enlarge.

Let’s take a look at how Federer is using sidespin to shape the ball off his racket. Figure 2 gives you a first hand look at what Mathieu sees coming off of the Federer racket. The moment the ball leaves Federer’s racket the ball begins swinging away from Mathieu’s forehand pulling him off court and creating a negative court position for him. The shadow of the serve trajectory illustrates just how much curvature Mathieu has to deal with. Let’s take a look at this from Federer’s end of the court (see Figure 3).

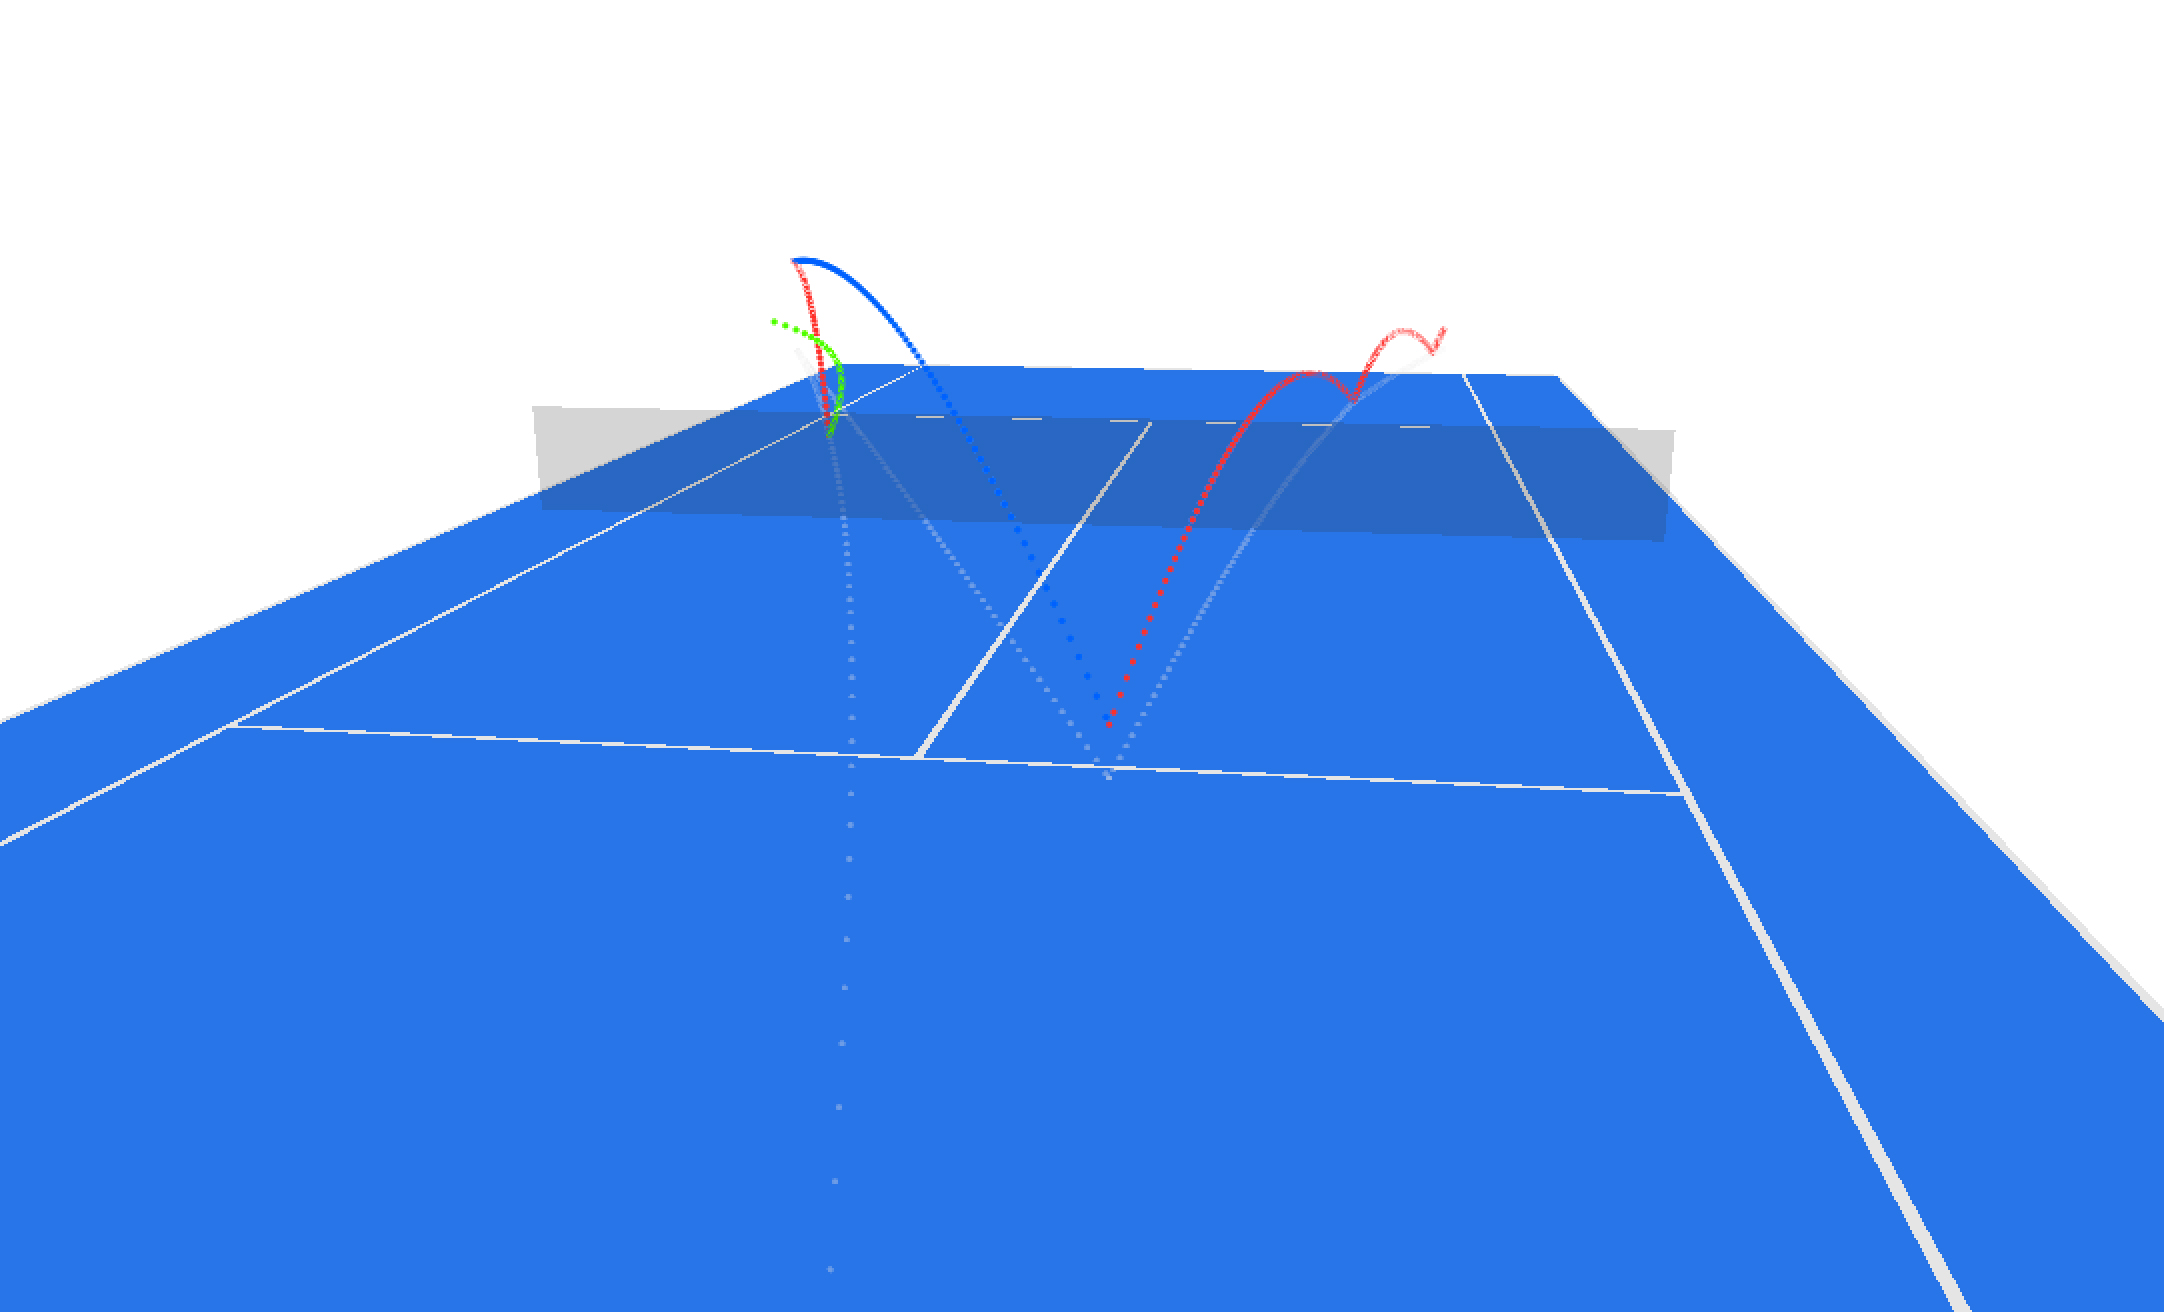
Federer serve trajectory Hawk-EyeFigure 3: The green line is Federer’s serve trajectory off his racket. This particular serve was recorded at 172 km/h. Click to enlarge.

From Federer’s end the sidespin is even more evident. Take a look at the right to left movement of the ball as seen on the green line above. You will also notice how little margin of error there is as the ball crosses the net, this is a typical property of a sidespin serve. The lack of top spin means the serve doesn’t rip up-and-over the net, instead it’s slicing down towards the court more quickly which results in tighter clearance over the net. In order to generate this amount of sidespin players pull back their serve speed in order to get the racket head around the serve on impact. This first serve of Federer’s was hit at only 172 km/h and landed in an OK position in the service box. Had the location of the serve been closer to the sideline, the serve may have well been an ace, as the ball would have been too far off court by the time it got to Mathieu for him to get a racket on the ball.

Federer has never had the biggest serve on the tour, but his precision and work on the ball has caused many of his opponents a headache or two in their day. The sharp curve and heavy sidespin gives Federer an instant advantage in the point, and puts his opponents in an immediately poor court position. What this does is force the returner to come up with a great return (which in this case Mathieu did, but Federer was too classy in this exchange) otherwise the point is quickly over with a volley, or one-two play. Djokovic experienced the Federer serve in full flight on Saturday, with the Swiss maestro bending it around like Beckham (as they say!). To top it off Federer brought his soft hands to the court and played a number of exquisite volleys, giving Novak no chance of getting into the long grinding baseline rallies that he thrives on. Let’s hope we see more of this attacking serve volley game from Federer as the 2014 ATP season draws to a close!

Visualisations created using 3D ArcGIS.

IBM “Data Wall” @ 2013 US Open

Late last year I received a call from the very talented crew at Hush in New York to help on a project they were building for the 2013 US Open and IBM. You can check out a video they put together to promote the work below.

The IBM Data Wall had three layers of interaction, Playground View, Simple View and Detail View. Each digital “tennis ball” represented a match and the wealth of data that every match produces, and sometimes even included predictions of the outcome.

My primary role on the project was to:

  • contribute ideas and design sketches
  • be a source of tennis knowledge
  • contribute as source of interpretation of data

Sean Klassen in a recent article on the Communication Arts website had this to say about the project…

“Sports are chock-full of data enthusiasts, so it’s great to see IBM and the U.S. Open taking advantage of that fact with some of the most beautiful infographics I’ve ever seen.”

The full article by Communication Arts which reviews the application can be read here.

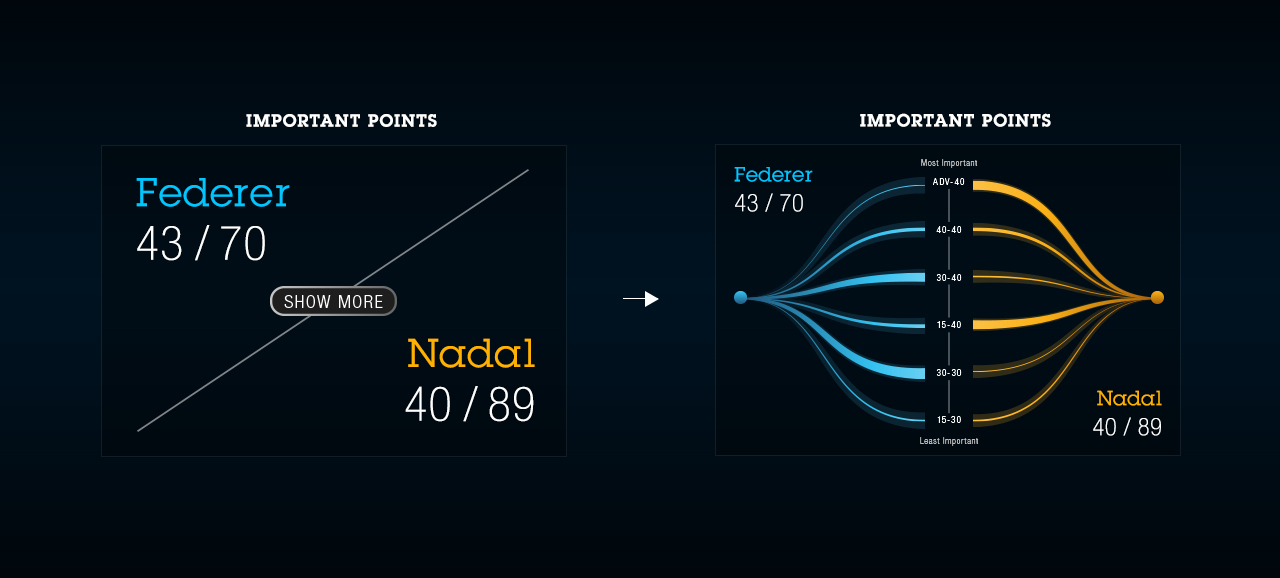
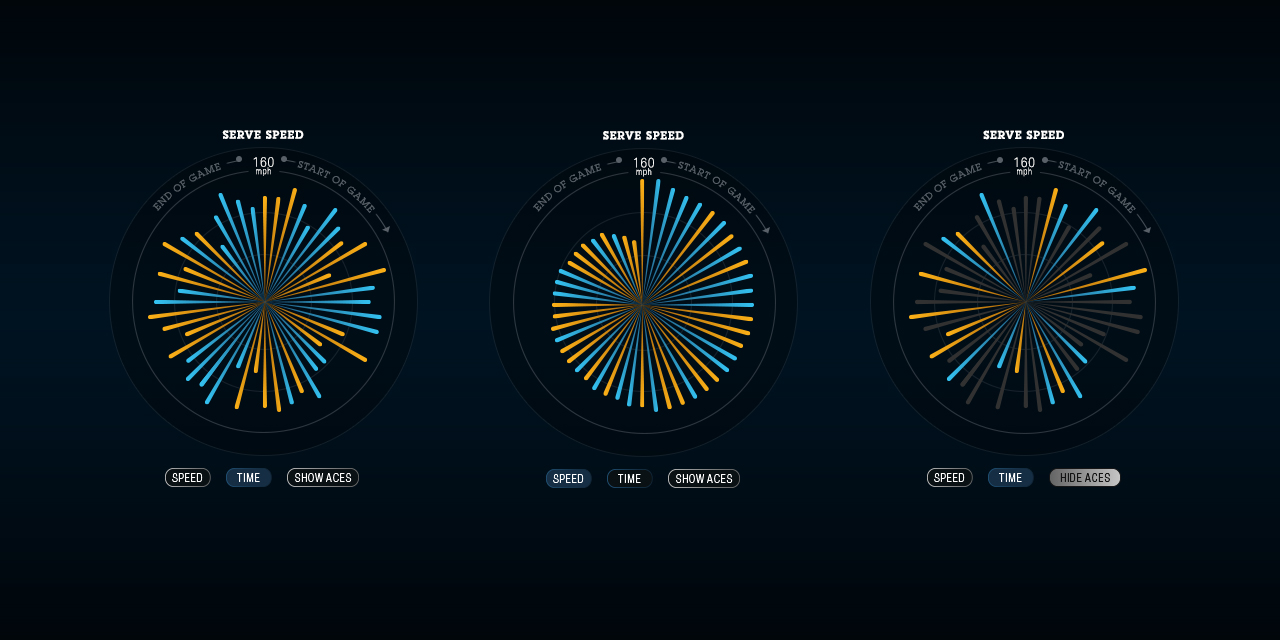
Some of my design sketches and ideas were transformed by the guys at Hush into these fabulous interactive infographics which were used in the final application (see below).

IBM Data Wall Important Point

TennisServe Speed Infographic

Source: http://heyhush.com/work/ibm/

The main interface to exploring the Detail View ended up like this:

US Open 2013 IBM Data Wall

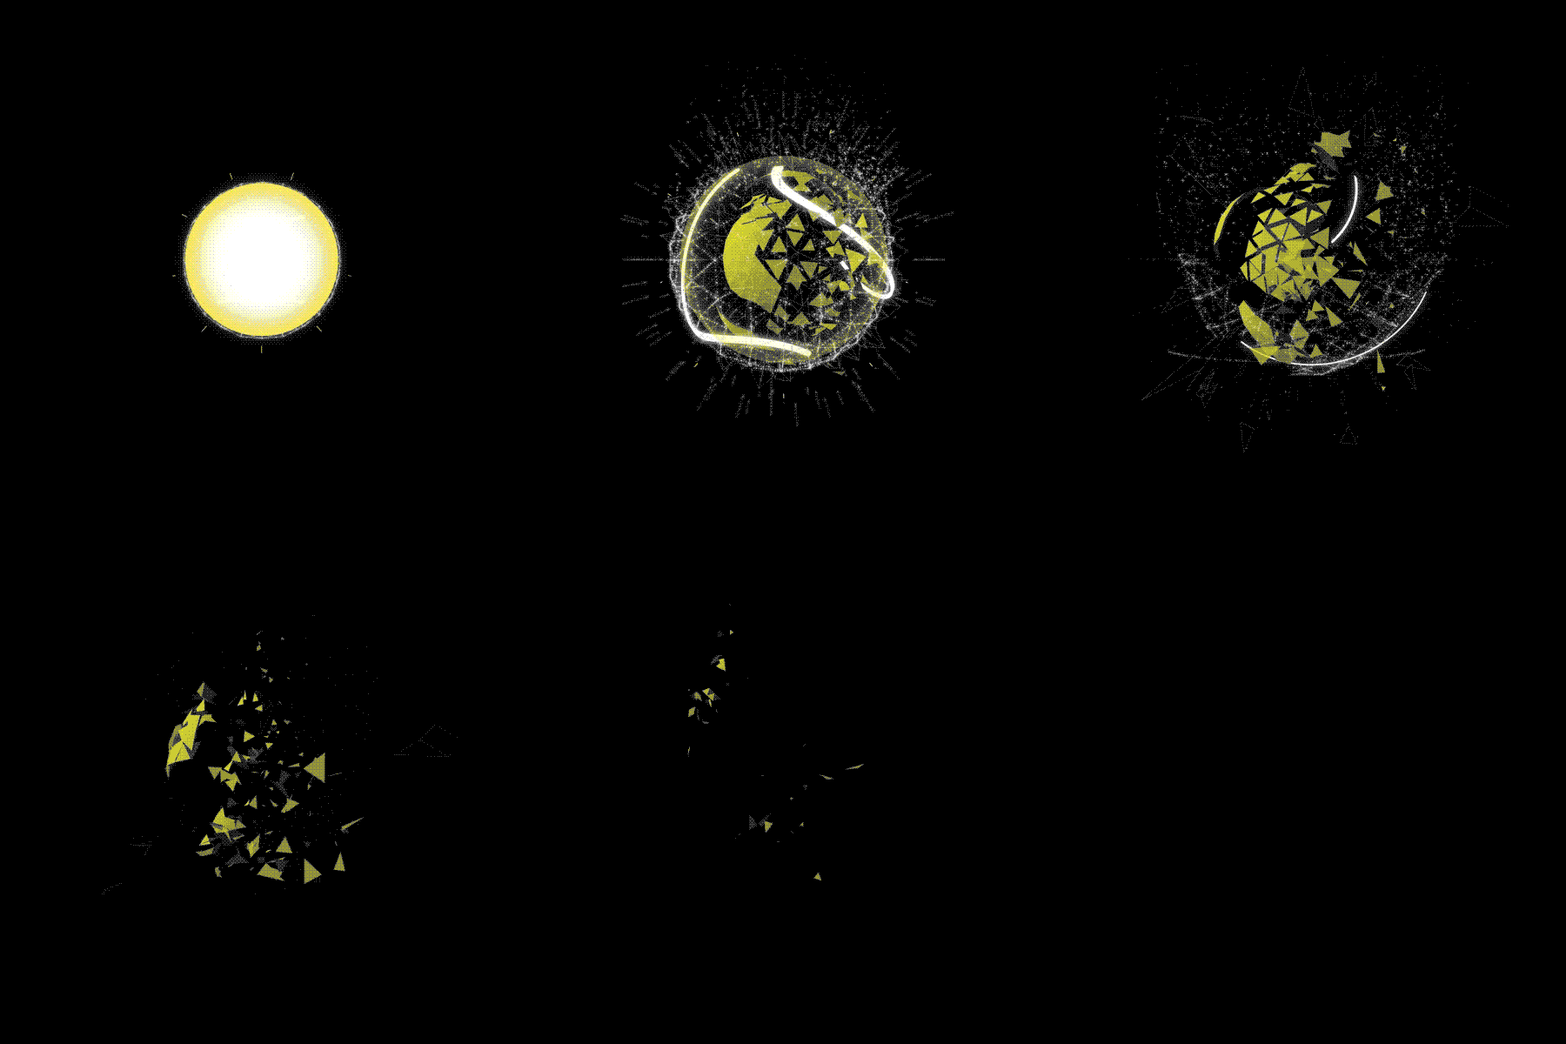
The guys at Hush had some fun with concept of an exploding tennis ball for the Playground View – they literally built this overnight!

Exploding Yellow Tennis Ball

A more comprehensive collection of screen shots from the application can be seen at Hush’s official website.

Enjoy!

Presenting a Diorama of Player Movement in Sport

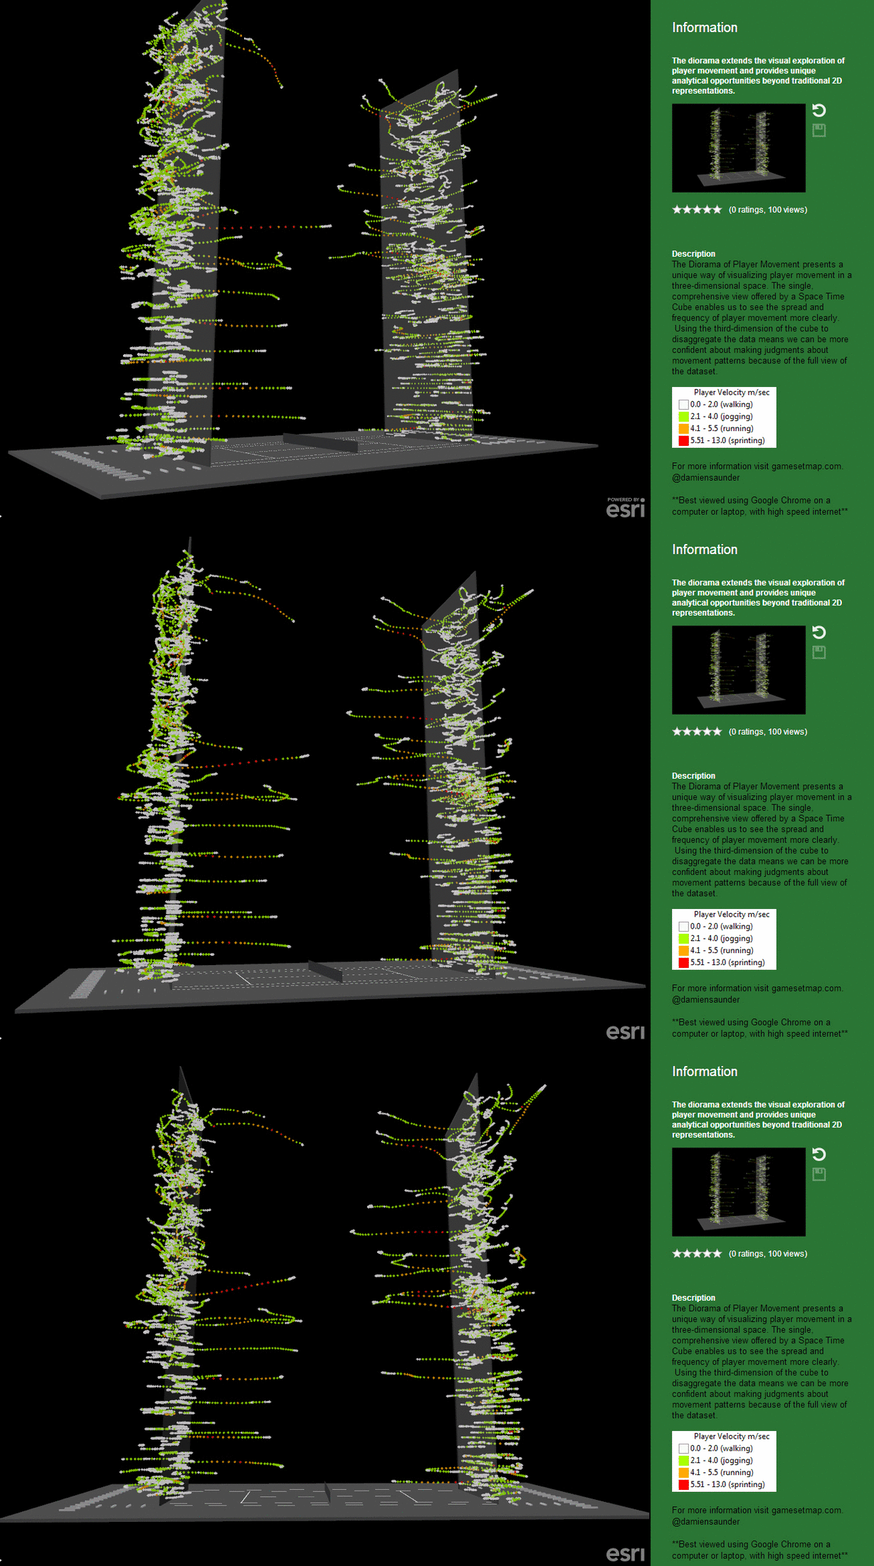
Earlier today Sports Performance and Tech magazine published my article on visualizing Hawk-Eye player tracking data. The article explores the value of 3D and Space Time Cubes when displaying spatio-temporal data.

To create the Diorama I used 3D optical tracking data from an official Hawk-Eye tennis match played between Roger Federer and Paul-Henri Mathieu at the Swiss Indoors in Basel, 2012.

Sports Performance and Tech Magazine

A Diorama of Player Movement in Sport

A Diorama of Player Movement in Sport

The full article can be read here.

A Diorama of Player Movement in Sport

To explore the 3D Diorama in more detail please visit the app here.

*** The app is best viewed on a computer or laptop using Google Chrome ***

How We Made Nadal’s Interactive Game Tree

Late last year we published an interactive game tree celebrating Rafael Nadal’s historic 2013 season. The Game Tree allows users to visually explore how easily, or not, Nadal won each of his 666 service games in the Masters 1000 Tournaments, Grand Slams and World Tour Finals he played in 2013. This rare point-by-point summary shows where Nadal’s history breaking season was won and rarely lost.

Nadal Game Tree

Figure 1. Nadal’s Interactive Game Tree was released after the completion of the World Tour Finals, November, 2013. Click here to view the application.

How the Project Began…

The idea for the project came about after years of frustration by never really knowing how close a match was by just looking at the final score. For example, a 6-4, 6-4 score-line could mean multiple things; one break of serve, or multiple breaks of serve. The winner may have won their service games easily, or they might have been hotly contested. Clearly, the final score gives no indication of the competitiveness of the match. To ease this frustration we set out to find a way to graphically present how hard Nadal was challenged in his matches during the 2013 season.

Our Inspiration

Inspired by Donato Ricci et al’s, (2008) game tree-like infographic (Figure 2), we set out to illustrate the path to victory using game tree theory. Sometimes referred to as a tree of possibilities, a game tree represents paths from a starting point to an end point, often in a game scenario like chess. Tennis plugs perfectly into a game tree as each player starts at 0-0 and makes a move in one direction only through the tree, depending on their success at the 0-0 point.
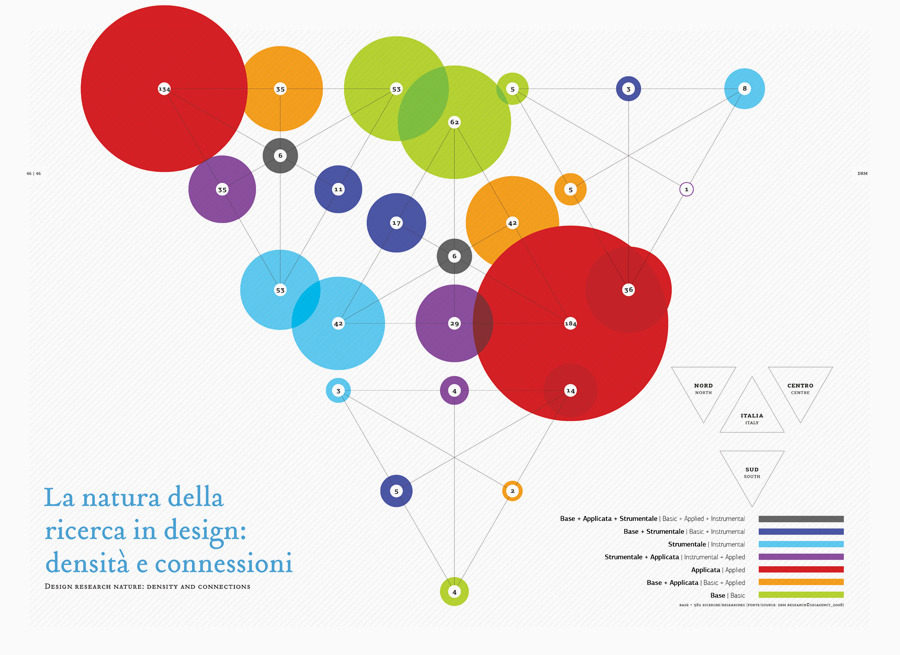
Ricci et al’s, (2008) map

Figure 2. Mapping relationships between events. Ricci et al’s, (2008) map of the most common research methodologies used by various Italian design firms.

In order to determine the effectiveness of Nadal during his service games we mapped the frequency of paths from one point in a game to the next. To do this, we borrowed concepts from a 19th century cartographic method, called flow mapping. Flow maps were first introduced by Henry Drury Harness in the Atlas to Accompany Second Report of the Railway Commissioners, Ireland (1837) (Figure 3).
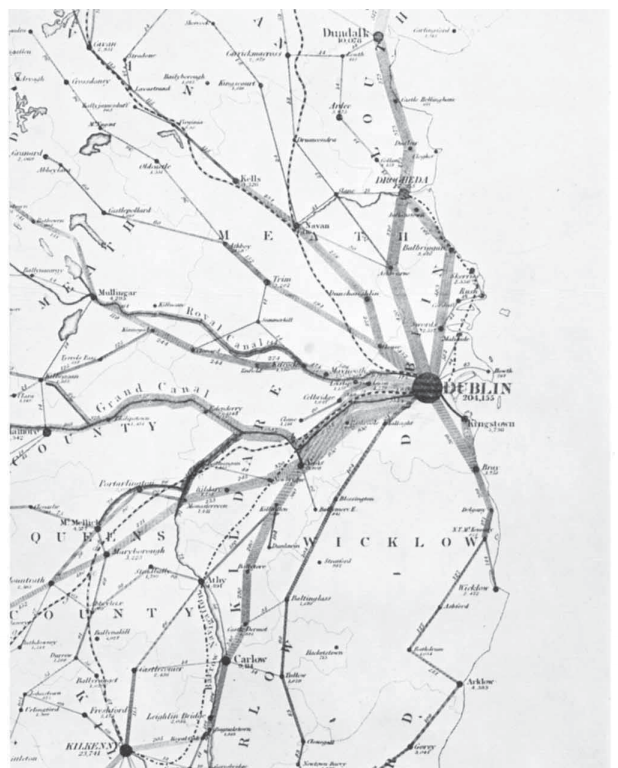
Henry Drury Harness Map

Figure 3: Henry Drury Harness introduced the first flow map in 1837. The map uses a variety of line thickness to convey a quantity of traffic flow between Irish cities.

The lines connecting each point in the Game Tree became the quantitative flow lines, and were scaled proportionally representing the number of times Nadal played through each point. The various line thicknesses allowed us to very quickly identify the most common path during each service game.

The Data & Technology Behind the Game Tree

To create the game tree we began by downloading all of the appropriate matches from the William Hill sports website as XML files. Each match was available as a separate XML file and these files contained high-level information about the match (players, tournament info, date, etc.), along with a detailed point-by-point breakdown of the match. After a preliminary assessment of the data we developed a javascript application, which looped through the files and began to process the points.
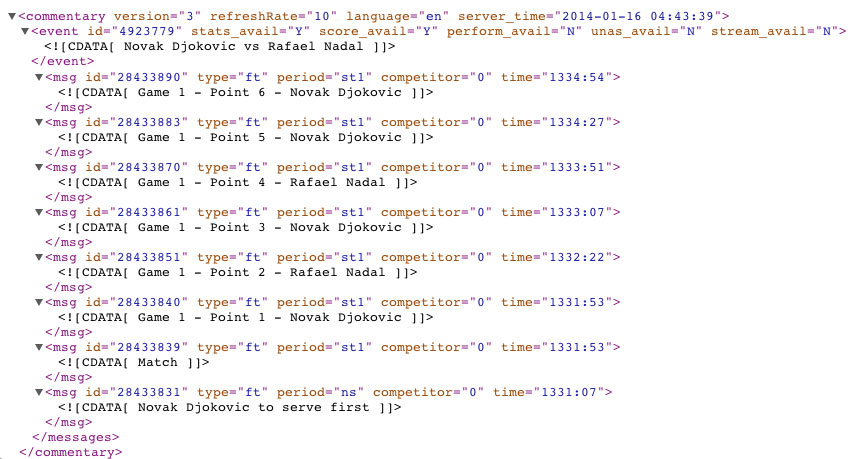
William Hill Data

Figure 4. An extract of data from the xml game files used in the game tree.

We then prepared a series of functions using javascript, to mimic the behavior of the game tree. The Game Tree at present only maps Nadal’s service games, therefore all point values of the opponents’ service games were simply skipped over and tie break points ignored. As the points are looped through and processed, we used the Rapheal javascript library to draw and animate the entire game tree using SVG (Scalable Vector Format). Some additional jQuery code was then added to hook up the tournament and match filters. The application was framed using HTML5, CSS3, SASS, Compass, and the Mueller Grid System.

Designing the Application

Our design work started off defining what the users expectations were from the application, and working out the simplest way of fulfilling their needs.

We defined a number of core functions the app should support:

  • The ability to compare game tree patterns at both the tournament and game level.
  • Multiple filtering at the season, tournament, and match level.
  • Interaction with the flow lines should reveal the exact quantities per line.
  • Tournaments should appear in the order they occurred, and the score should appear alongside each match.

Once we defined the core functions of the app we started sketching out how the game tree would support the application, and how we would visually organize the content for mobile, tablet and desktop devices.

Some of the earlier game tree concepts were centered on a circular game tree, before slowly transitioning to a more conventional representation of the tree diagrams (Figure 5).
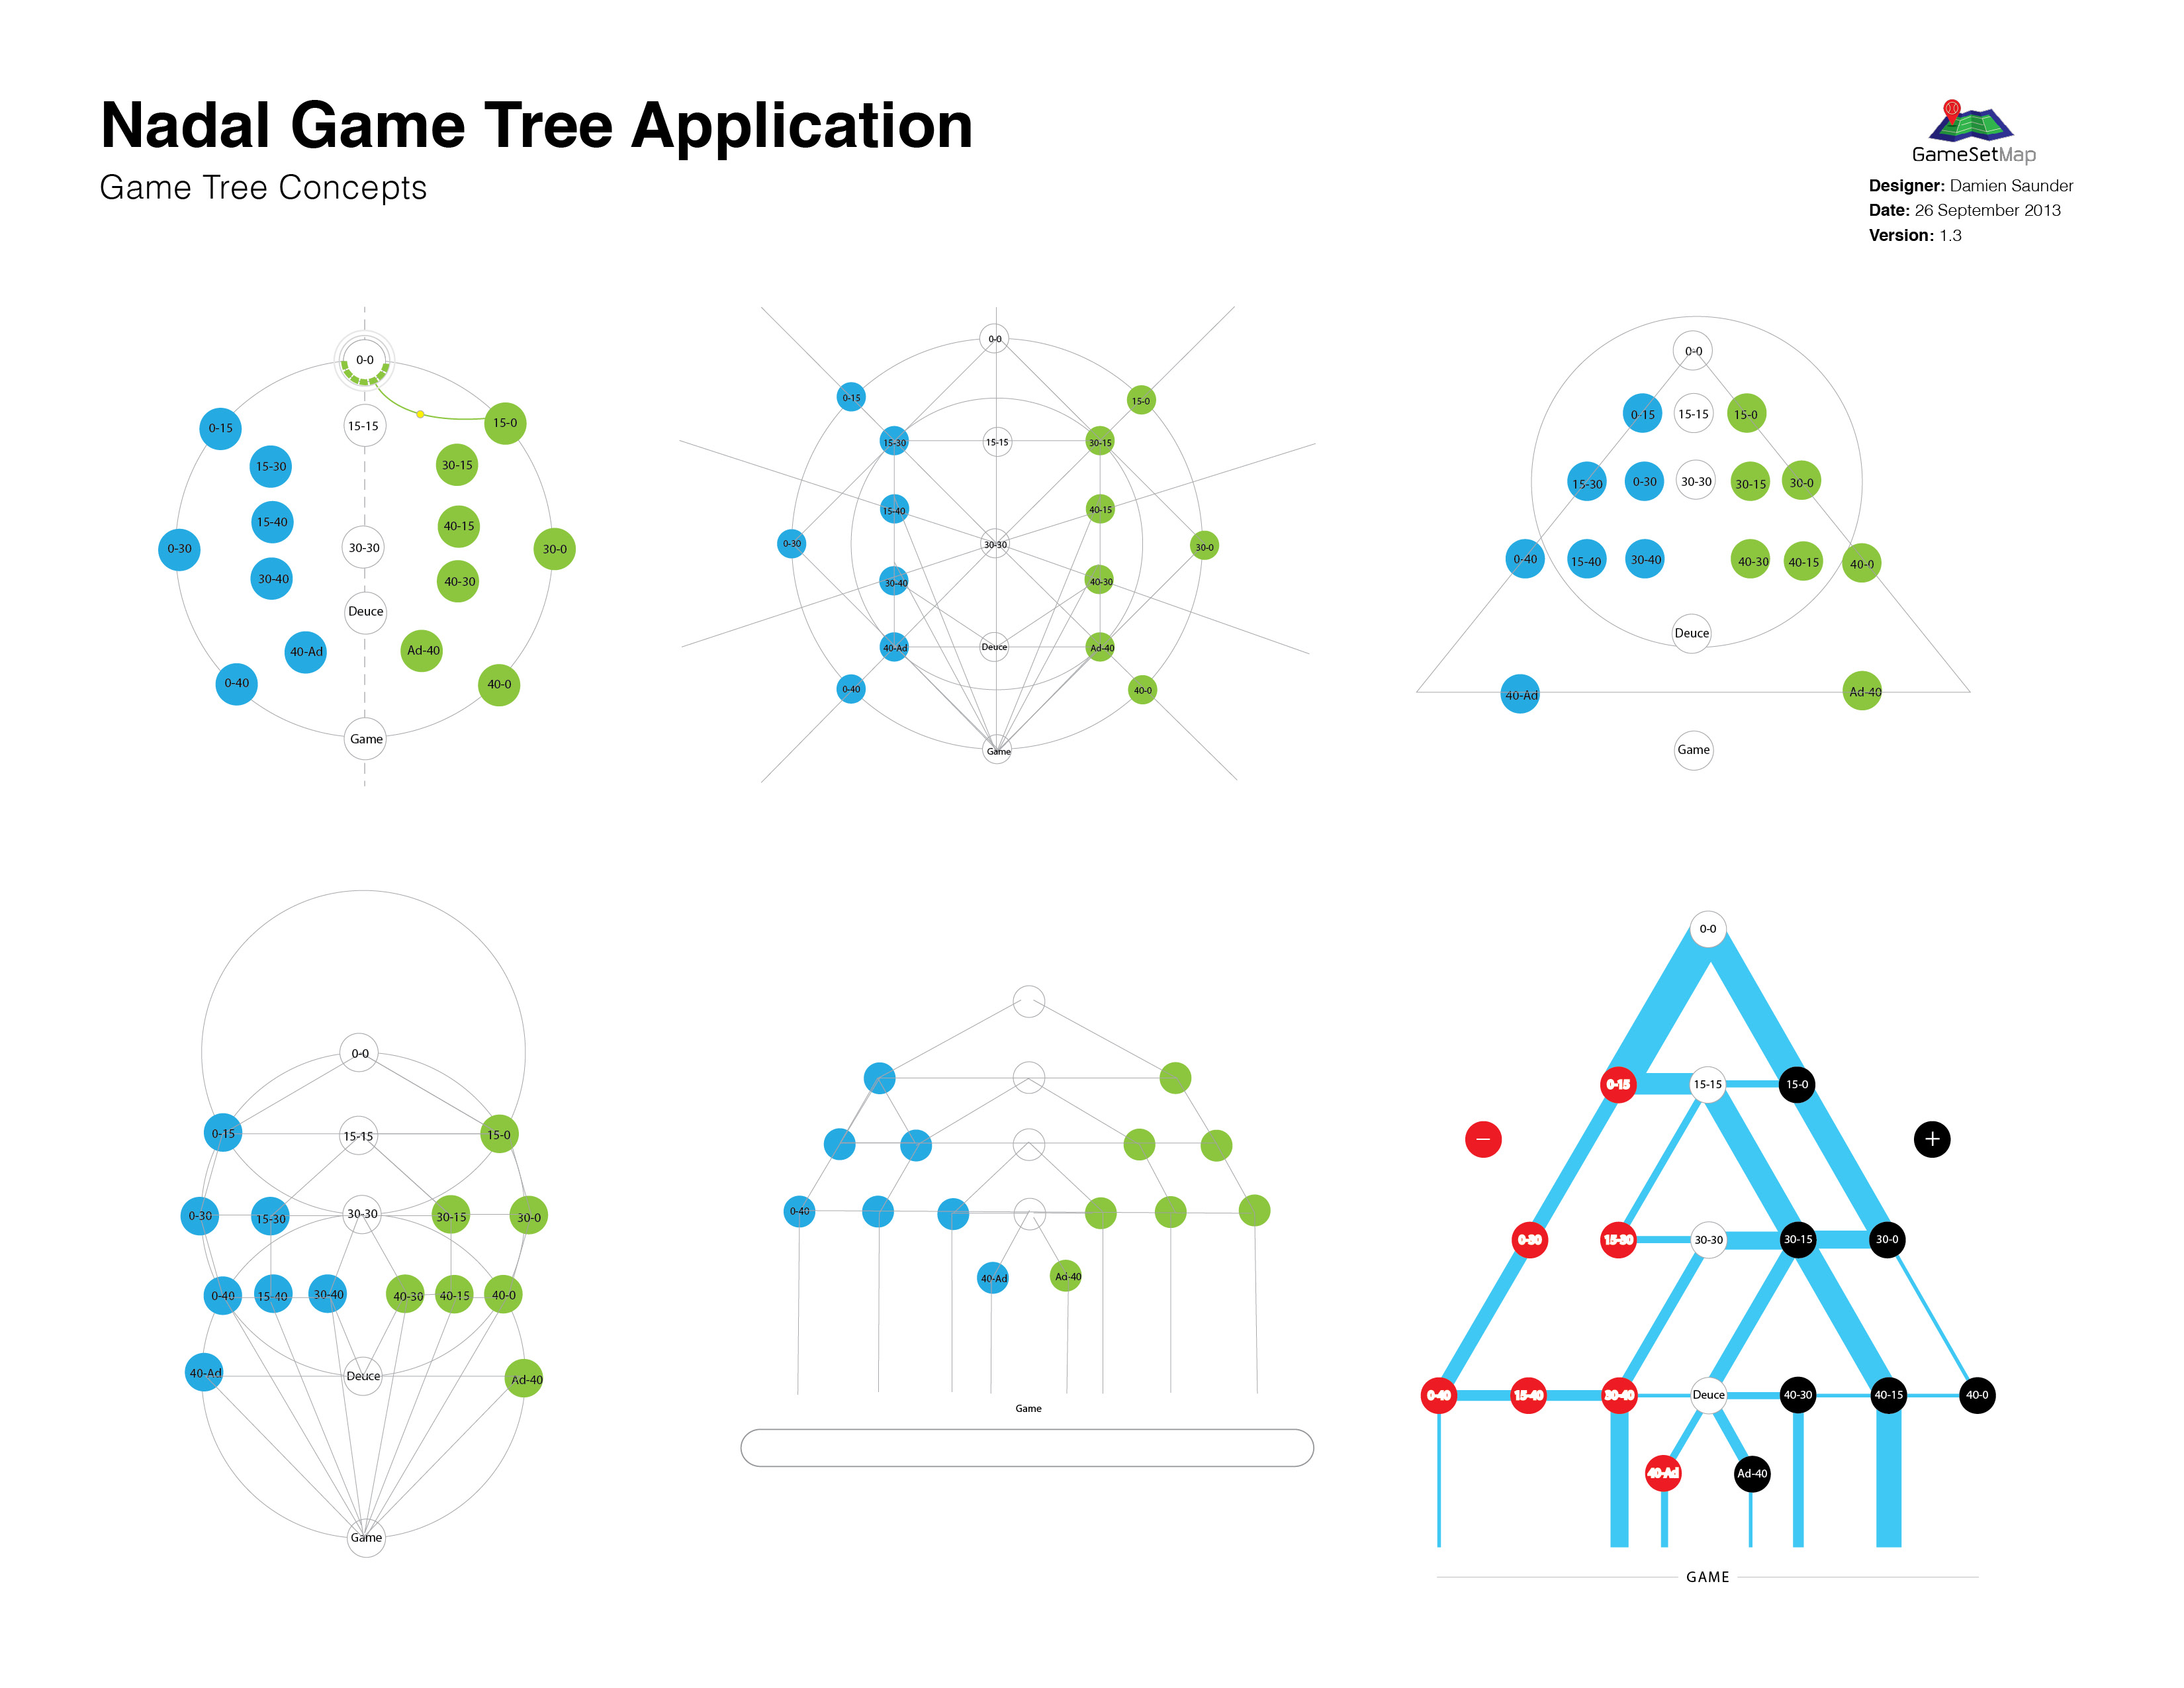
Sketching out the Game Tree

Figure 5. Sketching the game tree designs. From here it was a matter of refining the triangular game tree until the design begun to solidify.

It was important that we designed the game tree to be responsive across small and large devices. We needed to ensure a seamless user experience regardless of device type or size. To do this we introduced some mobile ready functions into the design. For example we collapsed the menu on smaller devices so the game tree remained the focal point of the application. And we re-arranged the text on the opening page for smaller devices (Figure 6).
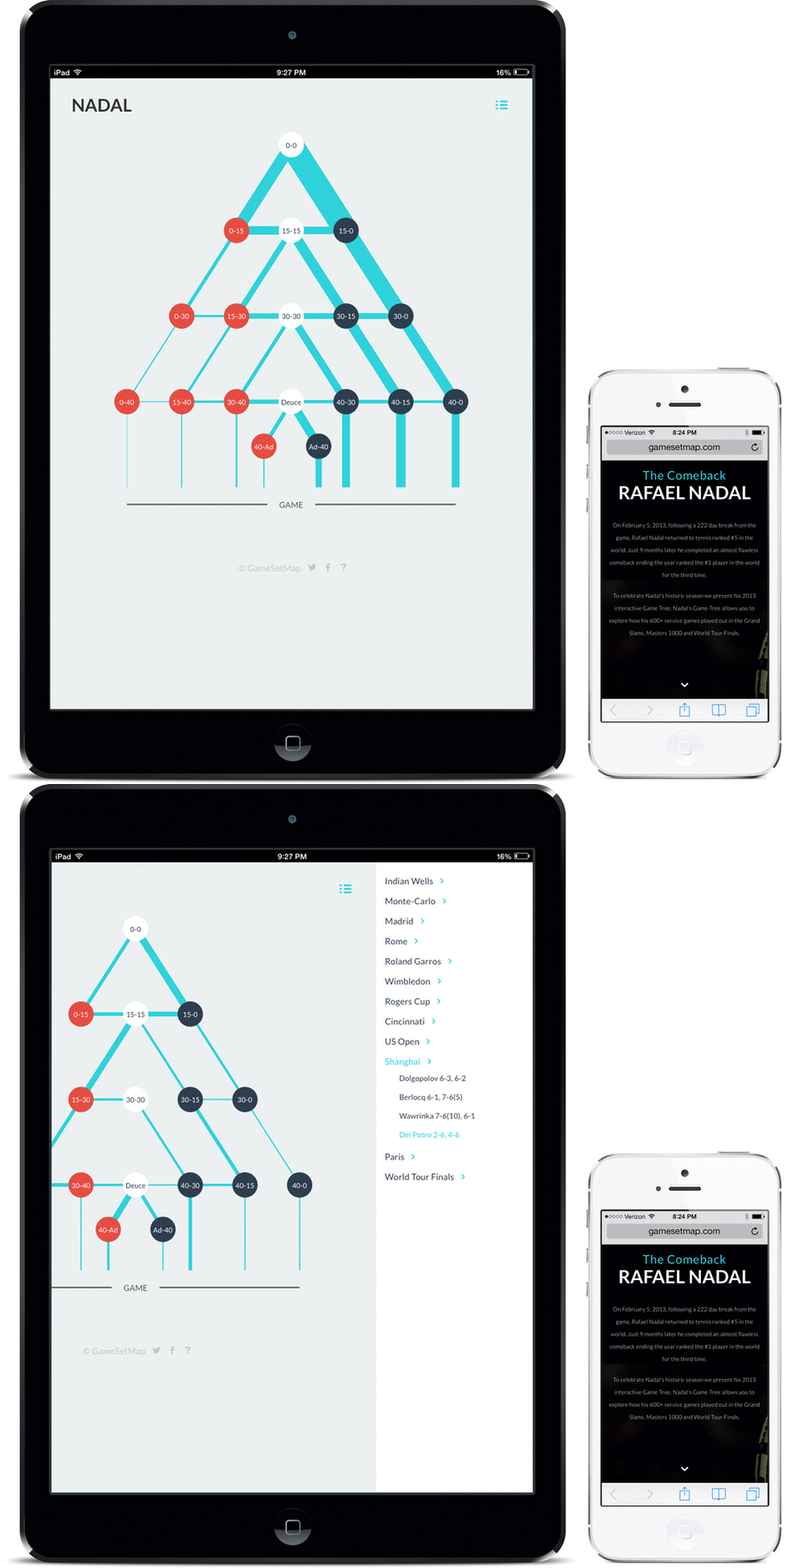
Responsive Design

Figure 6. Designing the optimal viewing experience across tablet and mobile devices forced a reshuffle of some of the key elements of the application.

Each point in the Game Tree was color coded to reflect the momentum in each game. Dark blue representing + positive momentum, red – negative momentum and the neutral points down the spine of the tree were colored white (Figure 7).
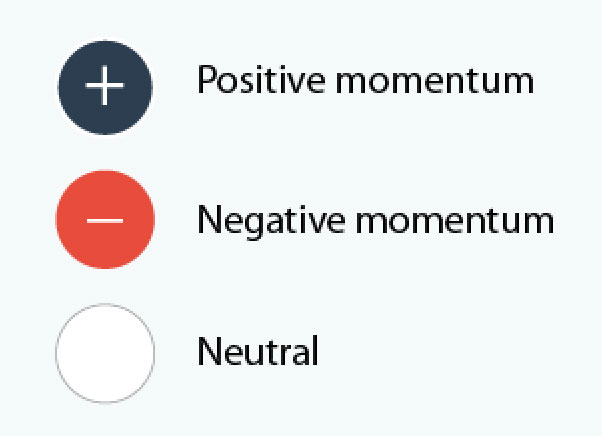
Figure7_Nadal

Figure 7. Each point in the Game Tree is color coded to reflect momentum in the match.

Results and Analysis

Nadal’s (6-2, 3-6, 6-4, 6-1) win against Novak Djokovic at last years US Open final illustrates the analytical power of the game tree (Figure 8).
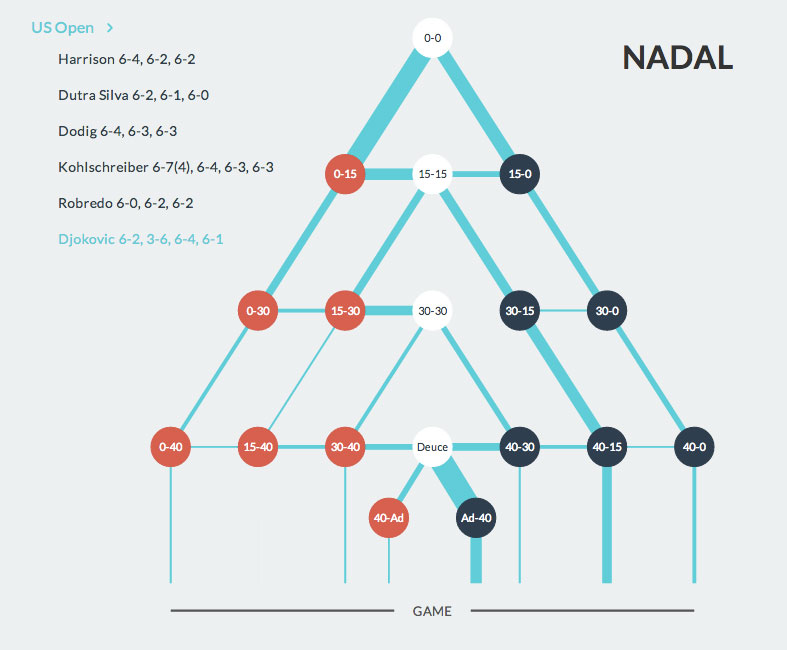
Nadal v Djokovic Game Tree

Figure 8. The US Open final played between Rafael Nadal and Novak Djokovic. The game tree clearly highlights where Nadal played the majority of points on his serve (Deuce to Ad-40 – 12 times)

The score from the match, 6-2, 3-6, 6-4, 6-1 indicates a fairly one-sided match. But the game tree tells us that Nadal won 6 of his service games from Ad-40, (more than any other point). He and Novak wrestled back-and-forth between Deuce and Ad-40 12 times on Nadal’s serve. The frequency/line thickness through this part of the tree suggests that Novak had many opportunities to break Nadal’s serve, and that perhaps this match was much closer than the score suggests.

Nadal’s victory against Stanislas Wawrinka in the final of Madrid (6-2, 6-4) shows us how brutal Nadal can be when serving (Figure 9).
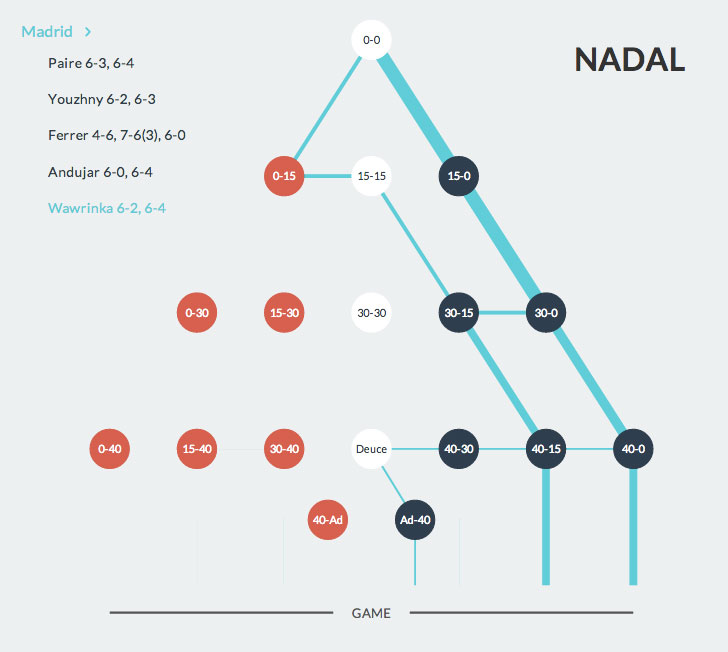
Nadal v Wawrinka Game Tree

Figure 9. An almost perfect service pattern. Nadal’s victory against Wawrinka in the final of Madrid (6-2, 6-4).

In 9 service games, Wawrinka never saw an opportunity to break Nadal in this match, coming close only once at deuce. Nadal’s remaining service games were won from commanding positions in the game (4 times each from 40-15, and 40-0). Nadal was only twice in the red zone (at 0-15). But each time he quickly pulled the momentum in his favor for a quick path to winning each game. Whilst the final score suggests a relatively straight forward win for Nadal, it’s not until we see his service games visualized in this manner that we truly understand his dominance in the match.

Conclusion

We believe this is the first ever-interactive point-by-point Game Tree of a tennis match covering an entire season for one player.

In both the Djokovic and Wawrinka examples presented above the game tree enabled a better understanding of the match than simply seeing the final score. The game tree presents opportunities for further analysis as well. For example we are able to determine where Nadal is most effective on serve. We can see that at Deuce, Nadal beats his opponents more than any other point. He fights back-and-forth between 40-Ad and Ad-40 (like against Djokovic in the US Open Final), but rarely losses when he is serving at Deuce. Across his 666 service games last season, his opponents only had a 1 in 5 chance (0.2) of winning the game from Deuce onwards.

The simplicity of the Game Tree application, and its ability to graphically present traditional statistical data in a unique and informative way allows users to better understand the final score of a match and how games are played out over time.

Craig O’Shannessy, leading tennis analyst for the NY Times, the ATP, and former panelist at the MIT Sloan Sports Analytics Conference labeled the application, “pioneering, and groundbreaking”.  It has featured heavily on well-respected data visualization websites like visual.ly, and visualisingdata.com. Nadal’s Game Tree captured the imagination of tennis analyst, fans, and data visualization experts worldwide for it’s originality and function.

Stay tuned for further interactive sports visualizations in 2014!

Click here to view the Nadal Game Tree application.

This article was written for the MIT Sloan Sports Conference.

Damien Saunder (formerly Demaj) is a Geospatial Designer at Esri where he designs and builds online interactive maps. He is continually rethinking spatial analytics for tennis via GameSetMap.com. @damiensaunder

David Webb is the web team lead at Rady Children’s Hospital-San Diego, where he builds responsive web sites and web applications. He enjoys experimenting and tackling interesting challenges via mor.gd.
Talk Like a Tennis Player: Word Clouds

Recently ASAP Sports released a bunch of Australian Open press conference transcripts via their website. I thought I’d have some fun and visualize some of the transcripts using a technique called a World Could, or Tag Cloud. A word cloud is a cool way of visualizing text data. A word cloud application ‘tags’ the most frequently used words in a document and makes those words appear bigger than the other less commonly used words. Word clouds allows us to very quickly visualize the most commonly used words in a website, document or in our case a press conference transcript. Ever wanted to know how to talk like a tennis player? Well here’s your chance!

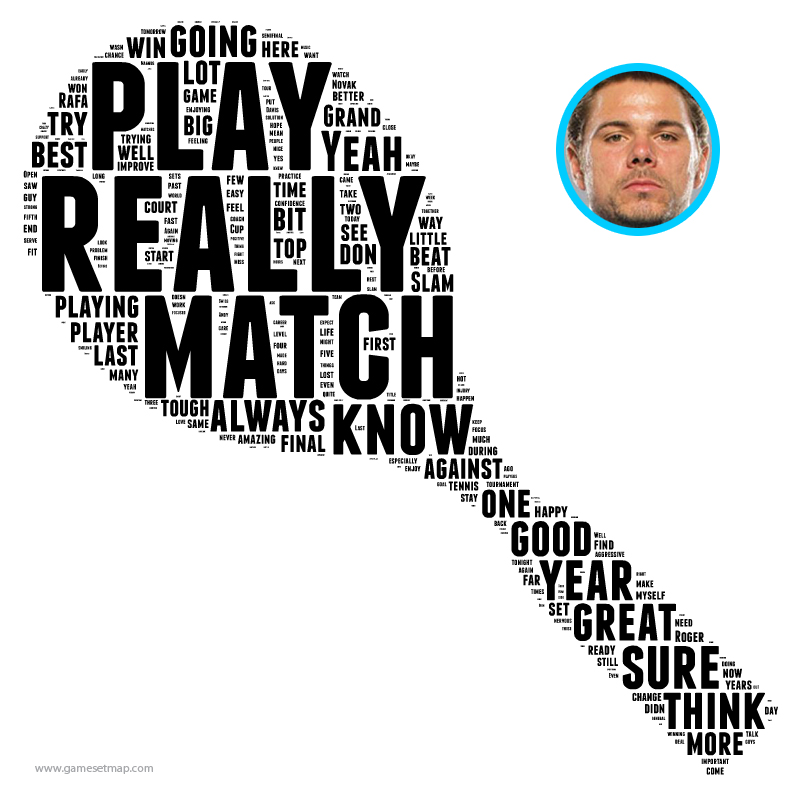
Creating a world cloud is really easy. There are many apps available online that do the tagging and arrangement for you. I used an app called Tagul. Let’s start with the new Swiss star of men’s tennis. Stanislas Wawrinka.

Wawrinka Word Cloud

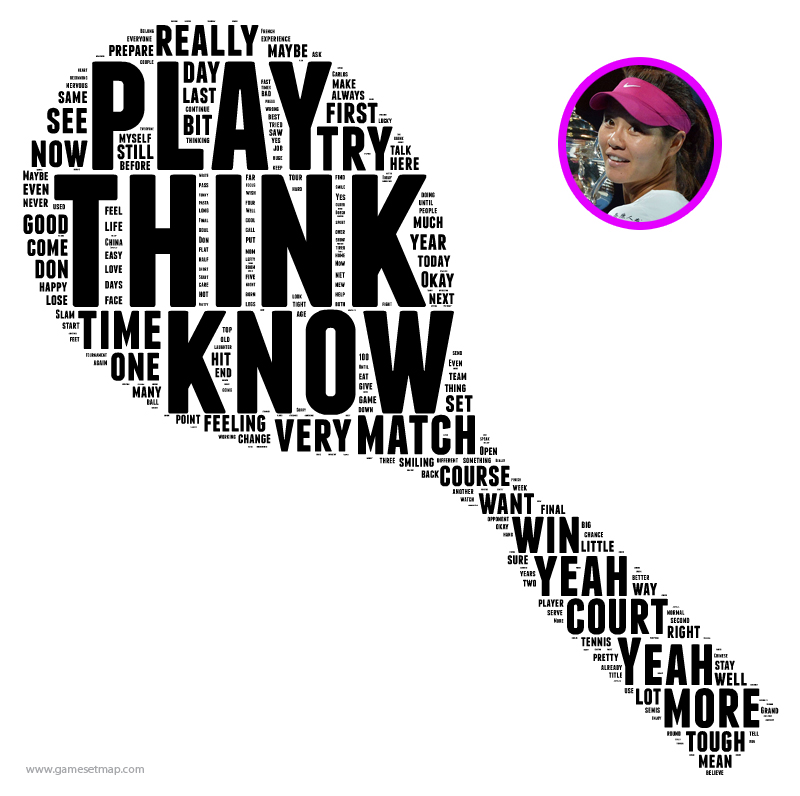
A blog like this wouldn’t be complete if it didn’t include one of the great characters of women’s tennis, and 2014 Australian Open Champ, Li Na.

Li Na Word Cloud

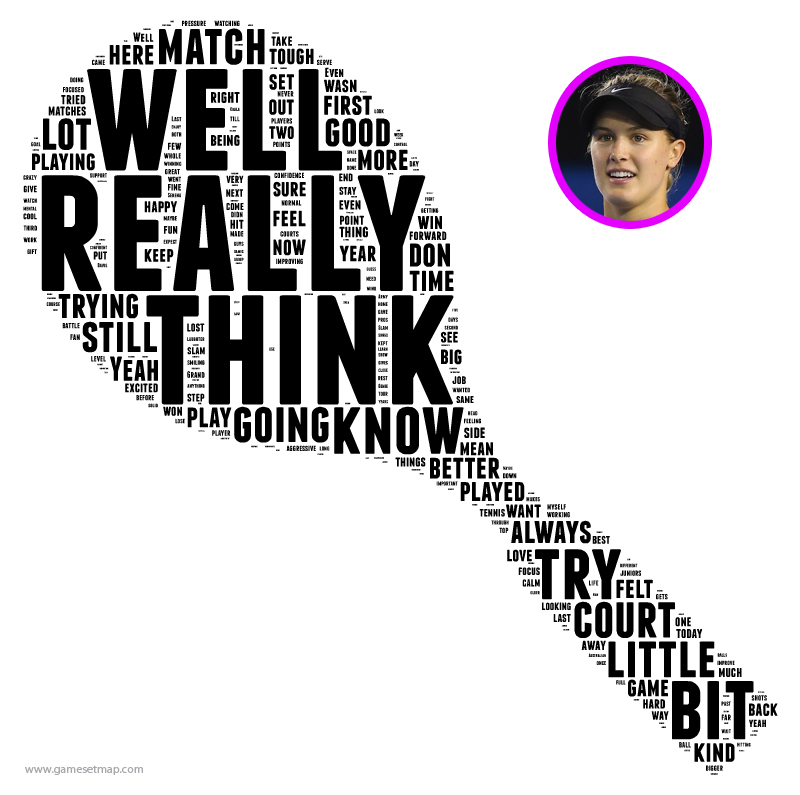
Now let’s take a look at a couple of the other big names from the Australian Summer. Eugenie Bouchard was the rising star in women’s tennis in 2013, and she kicked off 2014 with a bang making a deep run into the semis at the Australian Open.

Bouchard World Cloud

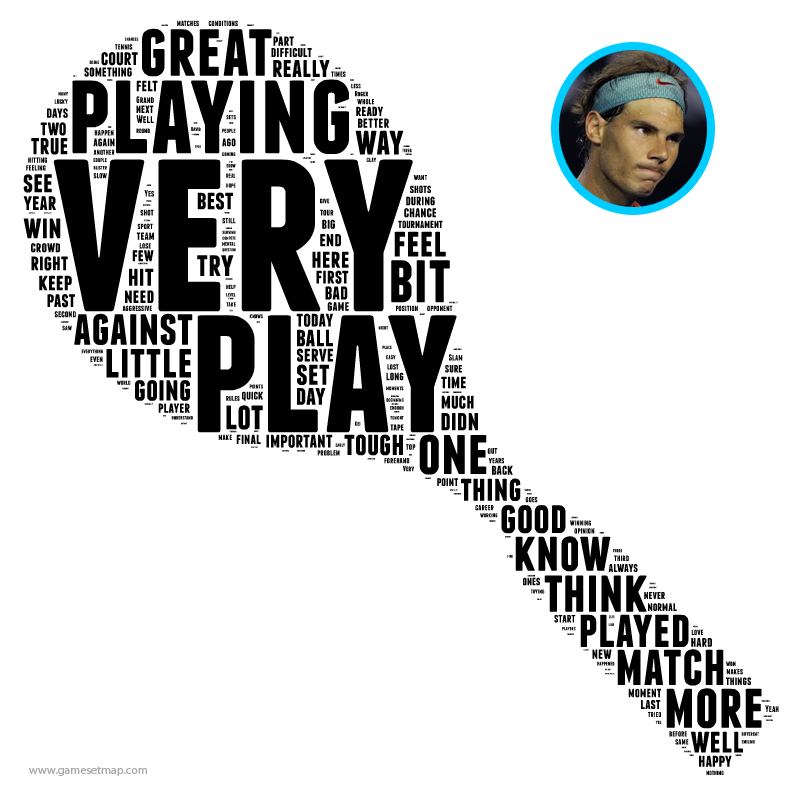
Rafael Nadal missed last years Australian Open through injury, but made an emphatic comeback in 2014, making the final of the first Grand Slam of the year. Let’s check out his word cloud.

Nadal Word Cloud

The top five most commonly used words by each player were:

Wawrinka: really (102), match (84), play (72), know (65), always (59)

Li Na: think (94), know (73), play (64), match (58), yeah (54)

Bouchard: really (72), think (61), well (47), know (46), bit (33)

Nadal: very (118), play (85), playing (60), great (59), against (58)

THE TOP FIVE: play (221), know (184), really (174), think (155), match (142)

So what are the words you need to know if you want to talk like a tennis player? Well you need to use “Play” a lot in your conversation. Be sure to tell everyone how you “Really Think” the “Match” went and tell the press you “Know” you’re “Playing” “Great”. Don’t forget to drop in some other fillers like “Yeah” (Li Na), “Bit” (Bouchard), “More” (Nadal) and “Always” (Wawrinka).

Given that English is only one of these players native language (Bouchard), there are surprisingly a lot of similarities amongst these four. I guess there is an element of monotony in the questions being asked during each press conference, hence the same words are used each to time to answer them!

OK, so I’m not going to get all geeky and try to run some deep and meaningful analysis on these word clouds, because quite frankly they were just a bit of fun. However we do know word clouds provide an effective way of representing text data in a fun and interesting way. In this case we were able to graphically summarize almost 30,000 words from the Aussie Open press conferences for Wawrinka, Li Na, Bouchard and Nadal (for what’s it’s worth!).

Note: The Tagal word cloud filters out common words like “a”, “some”, “this”, “us” etc.