Earlier this Japan’s National Broadcaster (NHK) contacted me to provide analytical support for a documentary they were preparing on Kei Nishikori. Part II of the documentary went to air in Japan recently and I thought I would share a few screenshots with you of the final animations and analysis.
The analysis focused on a number of key matches Kei had played over the last 12 months including:
- Wawrinka at the US Open, and Aus Open.
- Murray at Madrid and the World Tour Finals
- Djokovic at the US Open and Rome.
Below is a brief explanation and some examples of the analysis:
Nishikori v Wawrinka (US Open, and Aus Open)
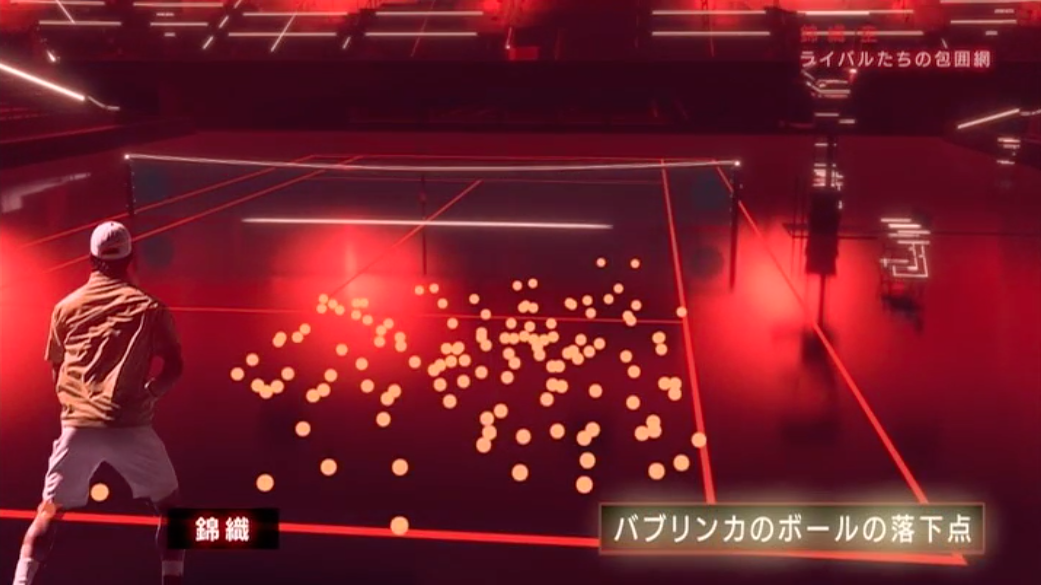
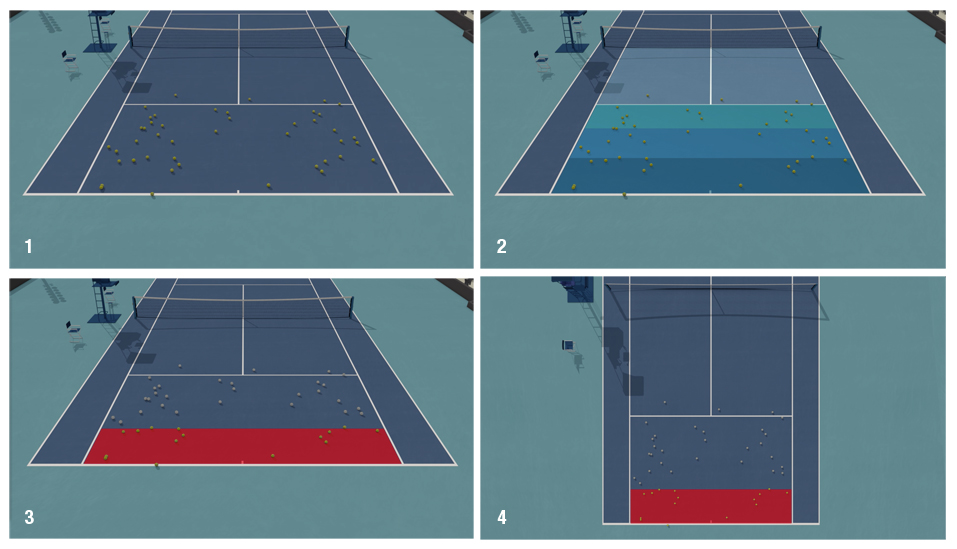
Wawrinka made some adjustments to his game after loosing to Kei at the US Open. The above graphic shows you the balls Wawrinka directed to the deuce side of the court at the US Open.
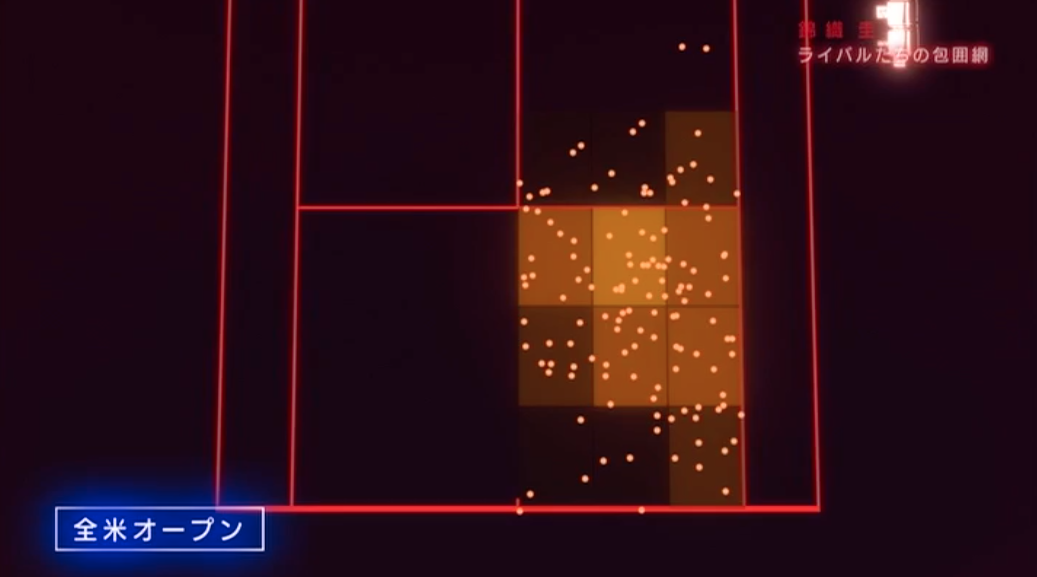
We saw from the footage that Wawrinka was targeting Nishikori’s forehand out wide and so we ran some numbers on it. We created a simple density surface of the shot location for Wawrinka at the US Open (pictured above) and at the Australian Open.
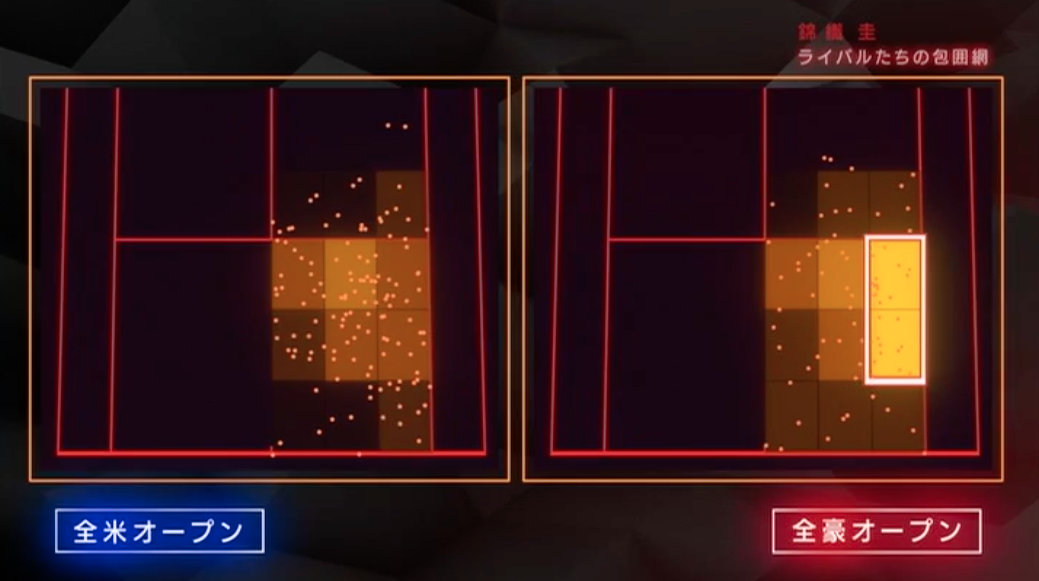
At the US Open Nishikori was given too much space and angle on his backhand and really made Wawrinka pay hitting a number of winners of this side. At the Australian Open Wawrinka made an adjustment and targeted Nishikori’s forehand, pulling him off the court with a number of short angled forehands. Below is footage of where Nishikori ended up on a number of important points which gave Wawrinka an easy shot into the open court.

Nishikori v Murray at Madrid and the World Tour Finals
Nishikori beat Andy Murray at the World Tour Finals in 2014 but Murray was able to turn the result around in Madrid during the clay court season earlier this year. One of the reasons why was because of his serving. In particular his accuracy and depth at important points. Murray also served far fewer second serves at important points in Madrid than he did at the World Tour Finals. If you’re serving short 2nd serves to Nishikori at important points than Nishikori is going to be all over the return and you’ll be playing catch up all point!
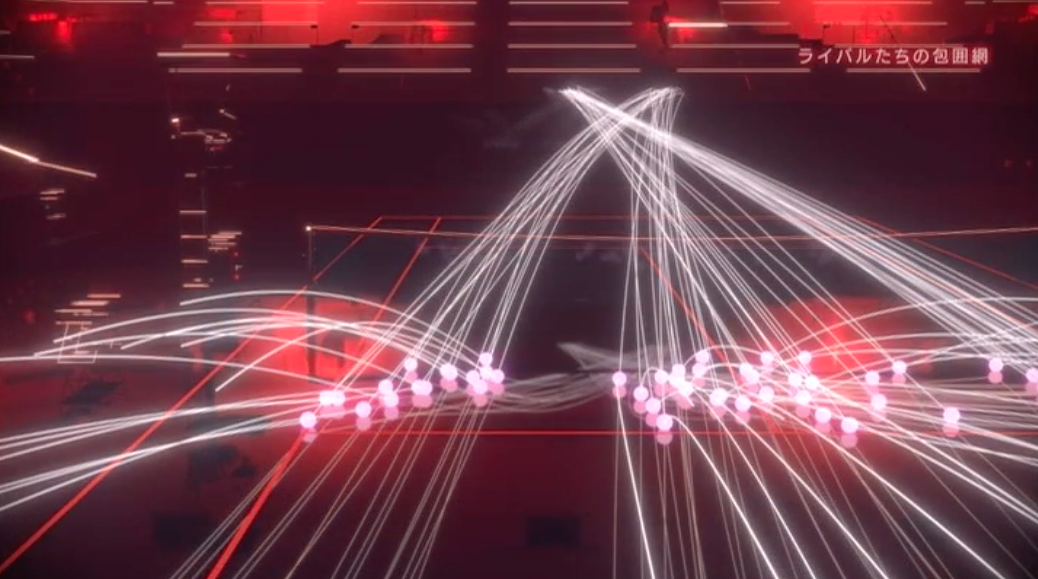
Above is Andy Murray’s serve pattern at the World Tour Finals (where he lost).
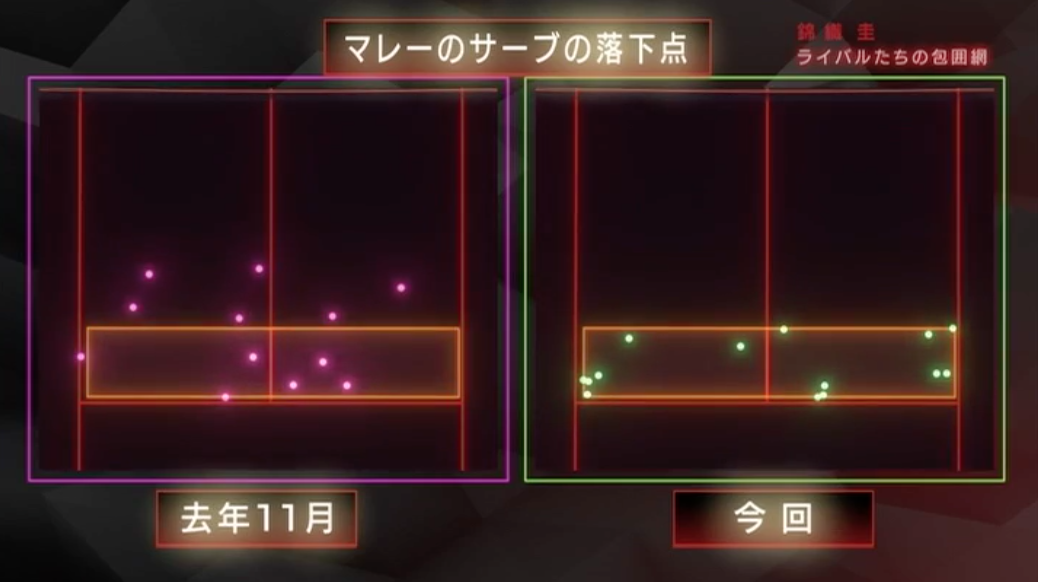
In the purple are Murray’s serve locations at important points at the World Tour Finals. In the green are Murray’s serve locations at important points in Madrid. Check out the six short serves that Murray dropped at the World Tour Finals (these were all second serves). These provided easy pickings for Nishikori. By comparison, Murray only served 1 second serve in Madrid, and his 1st serves were much closer to the lines in Madrid.
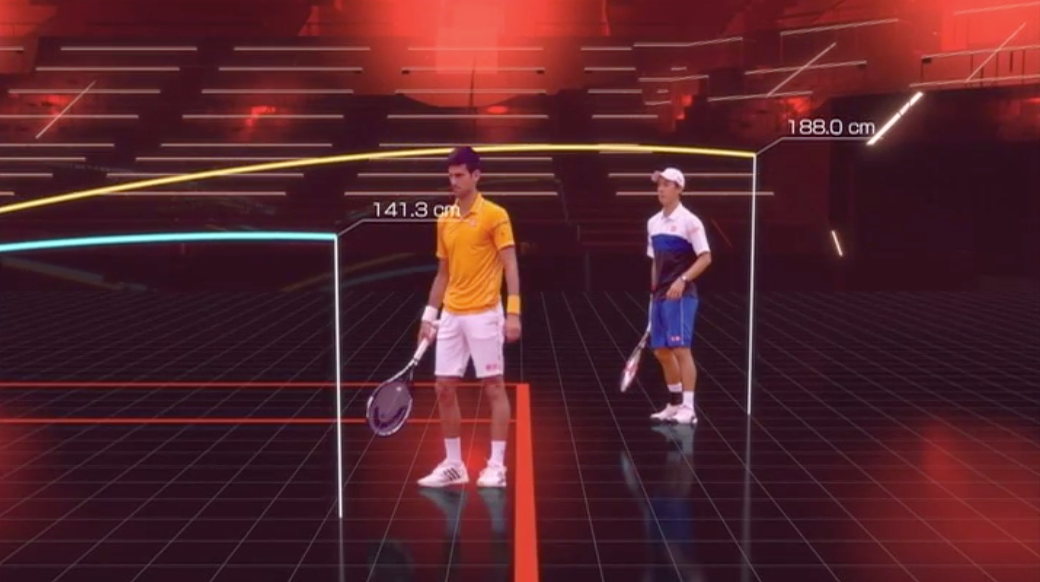
Murray was also getting some heavy rip on his serves in Madrid which forced Nishikori to regularly hit the serve return above his shoulder making it hard for him to get any real pop on the return. Murray’s serve in Madrid made it very difficult for Kei to gain the ascendency in the rallies. Players are looking to expose Nishikori’s height particularly on the serve return where he can be very damaging. Both Murray and Djokovic (in Rome) went after this as the neat little graphic below illustrates. It shows a comparison of the average height Nishikori’s was playing his returns against Djokovic at the US Open (blue) and Rome (yellow).
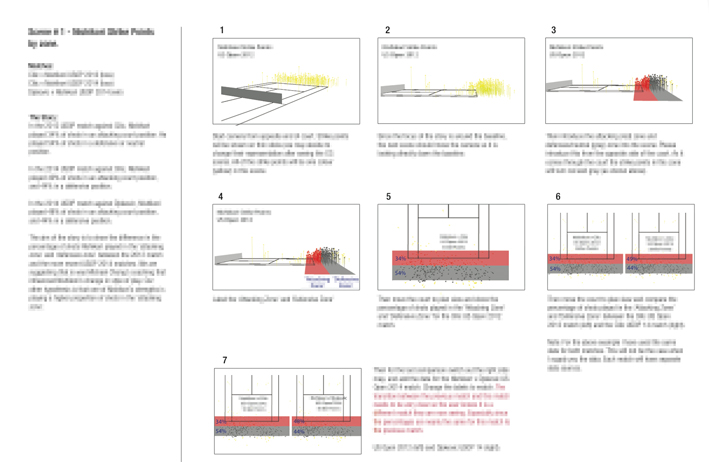
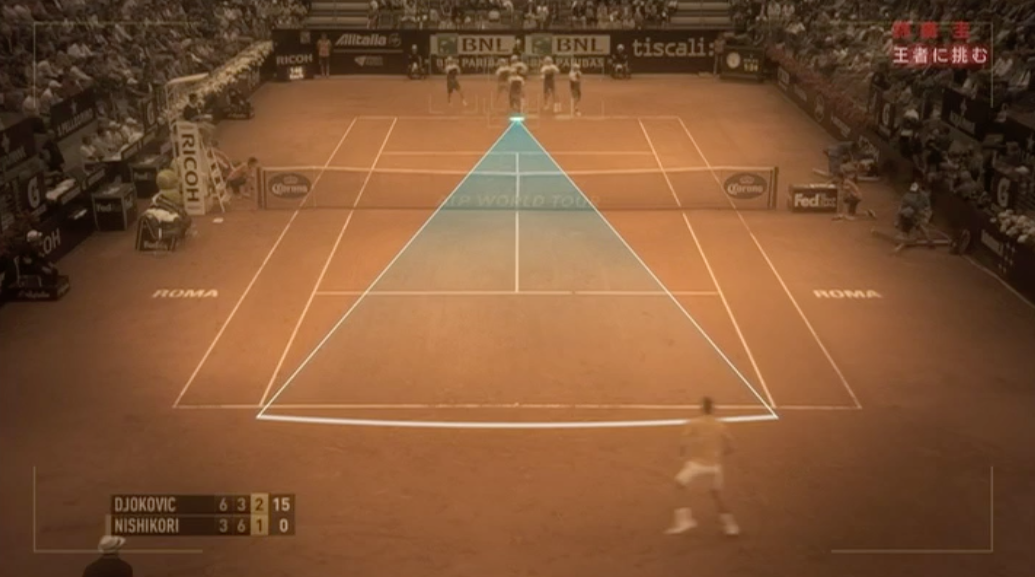
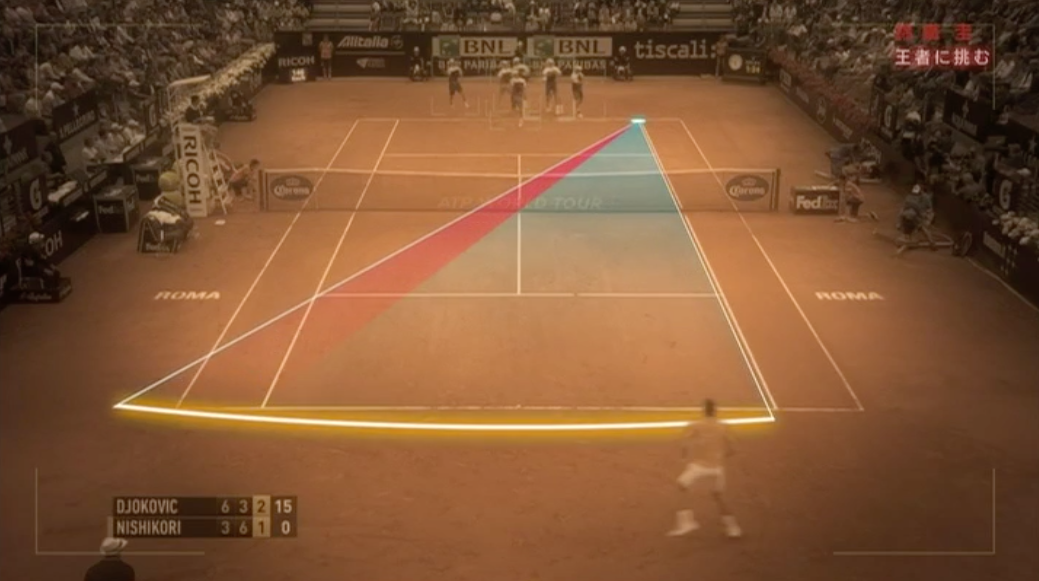
We also identified that the three opponents (Wawrinka, Murray and Djokovic) played much straighter through the court against Nishikori after their losses at the US Open and World Tour Finals. The two graphics below highlight what this means for Kei. His opponents took away the angle from him on his groundstrokes and didn’t allow him to pull the trigger, particularly from the backhand corner which is one of his favourite shots.
 Well there’s just a few examples of the visualisations and analysis we run for the show. Millions of data points, and hundred of hours of data mining and statistics were run in search for answers to so many questions. Unfortunately I can’t share any of the analysis in depth with you but hopefully this gives you a little taste of the some of the analysis that was completed. It was a real privilege to work with the talented team at NHK, they have an extraordinary high work ethic and seek perfection in their work. We are all extremely proud of the result.
Images copyright NHK. Do not share the contents of this web page without permission from Gamesetmap or NHK.

