Stroke Pattern Analysis

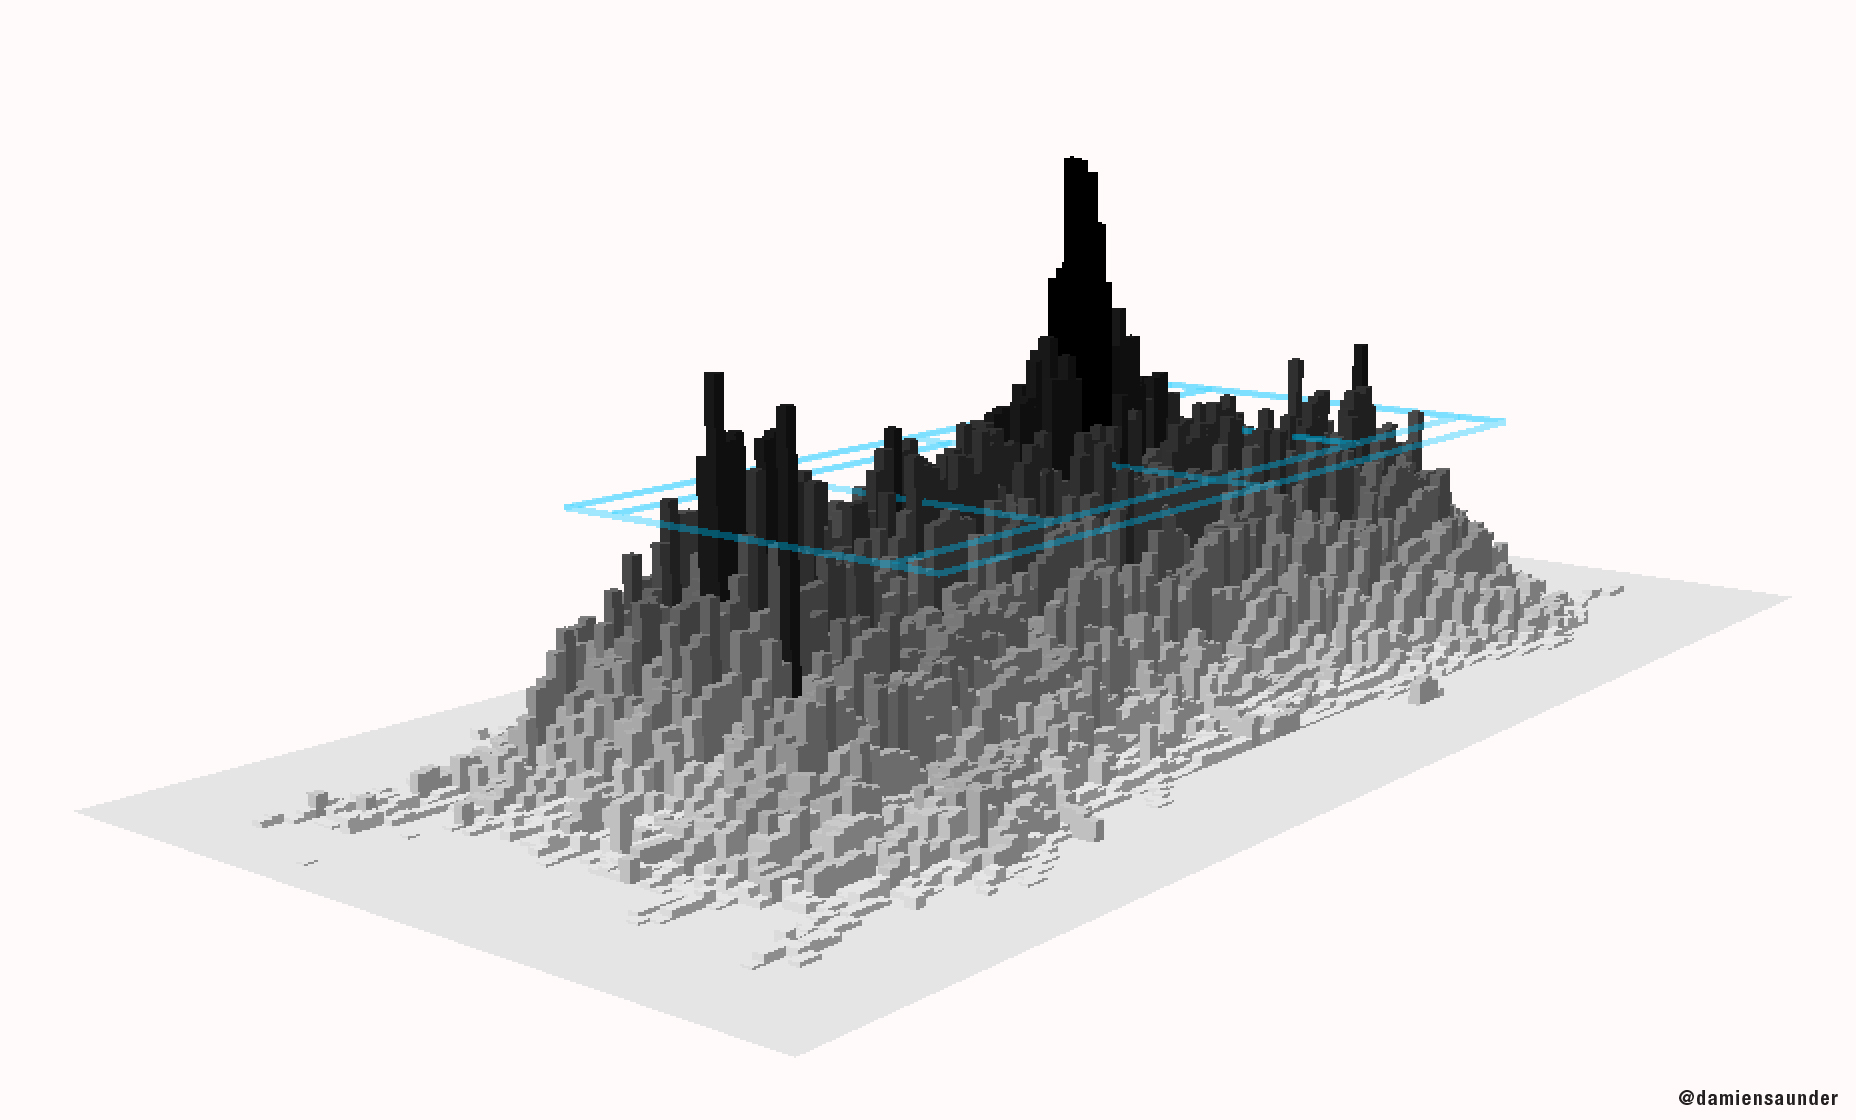
Late last week I was running some exploratory analysis on stroke patterns for a client when I stumbled across this during one of my 3D sessions.The image is a 3D heat map and shows the frequency of ball movement on the court. A heat map is a essentially a graphical representation of the data where individual values contained in a each cell on the grid are represented as colours, or by height. For example the tallest and darkest areas show where the ball was most frequent, and the shortest lightest grey areas show where the ball was the least frequent. You can see (as expected) that the ball passed over the central part of the net more than anywhere else on the court. Both these players were right handers and the majority of cross court exchanges were played from the backhand side of the court. You will also notice that tall pillars exist at each end of the court where the serve is hit from.

3D Tennis Hawk-Eye<click image to enlarge>

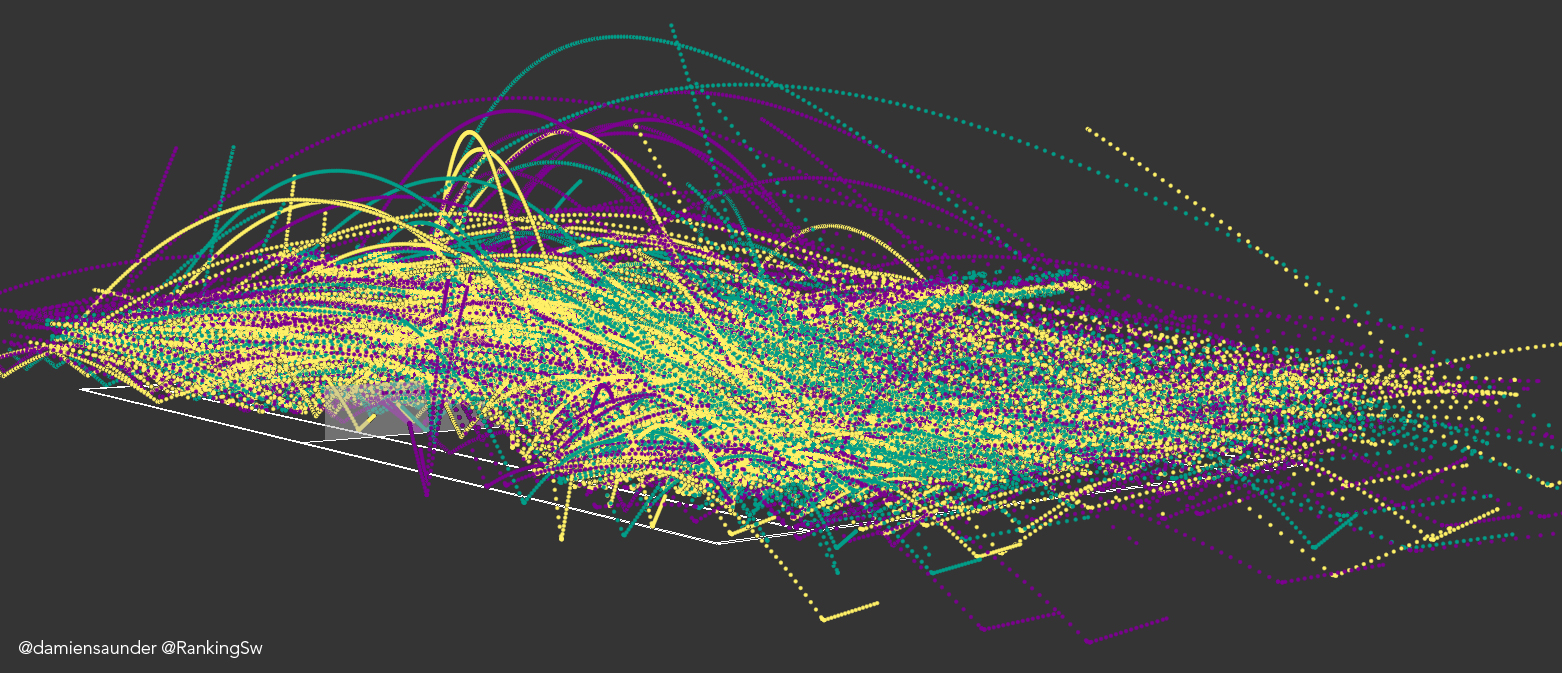
The data used in this visualisation is from official Hawk-Eye data played over 5 sets at the US Open. The raw data contains 10’s of thousands of data points and it is impossible to detect any sort of pattern in the data without applying some sort of cluster analysis to the data. The 3D aspect of the visualisation accentuates the values in each cell even more. Unfortunately in this static image the tall pillars hide other pillars behind them making it difficult to get a true feel for the overall pattern in the data. Thankfully in the live 3D scene you have the ability to constantly change your viewing angle so the problem of hidden data is largely void. The grid spacing used above is 30 cm.

There are many ways which you can cluster your data to provide more meaningful insights. Heat maps provide a quick snapshot of your data and help better understand the key components of your data. From here I’m taking a deeper dive into analysing stroke patterns. The analysis continues…

Kei Nishikori – Hawk Eye Analysis

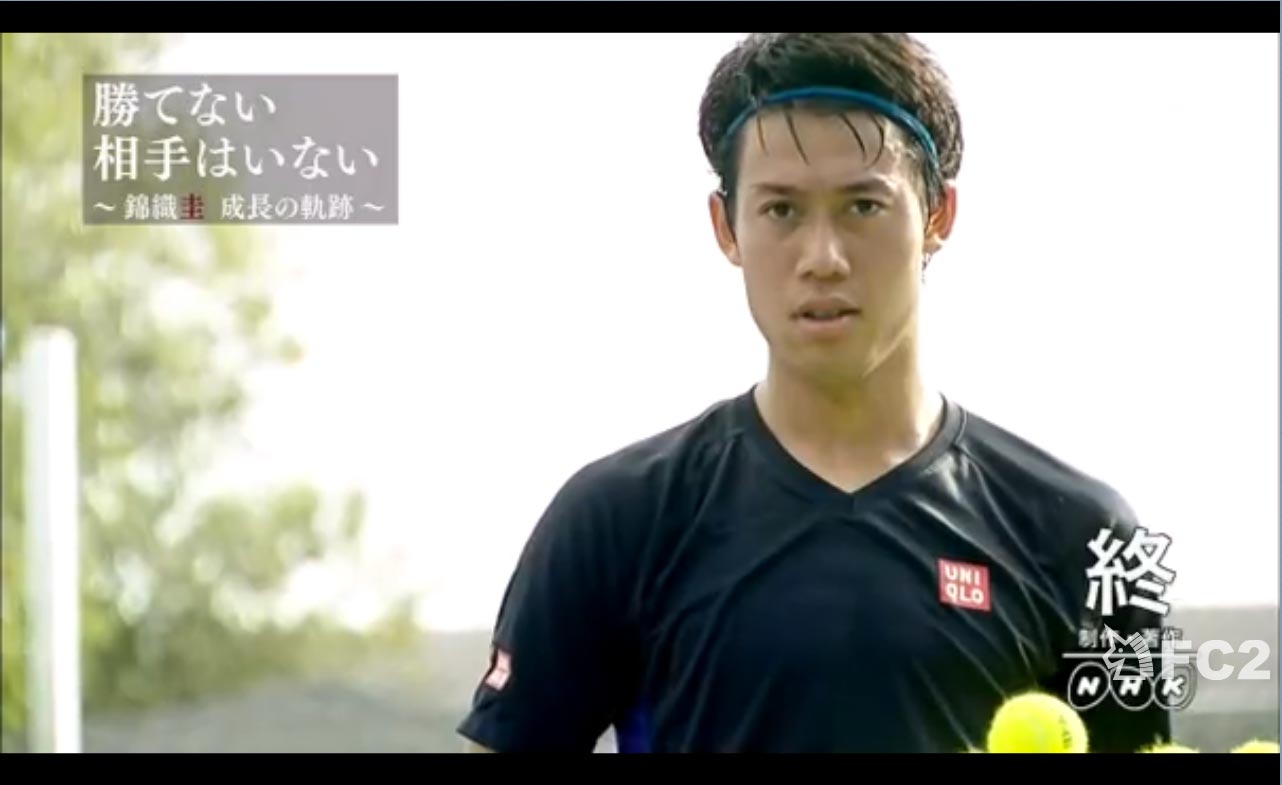
Recently Japan’s National Broadcaster (NHK) contacted me to provide Hawk-Eye analytical support for a documentary they were preparing on Kei Nishikori. I was asked to process and analyze the raw Hawk-Eye data. I teamed up with Jordan Montreuil, an animator from LA to provide high-quality 3D scenes that would support the analysis. The documentary aired in Japan on the 13th January prior to the Australian Open. You can watch the program here.

Blog Pic Nishikori

The rise in popularity of Kei Nishikori is illustrated in NHK’s documentary titled “Kei Nishikori: Trails of the Progress” (translated). The documentary explores Nishikori’s growth and development as a player.

Below are a few samples from the project. Unfortunately I can’t share too many details but I hope this gives you some idea of the work completed.

Hawk-Eye Animation

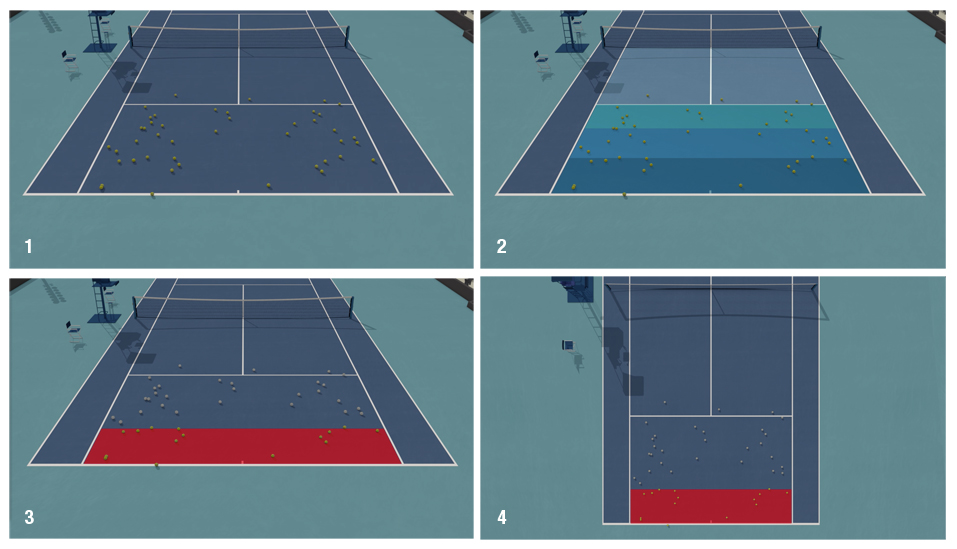
The results of the Hawk-Eye analysis were told using a series of 3D computer generated (CG) animations. The images above are stills taken from the story surrounding Djokovic’s shot depth against Nishikori at the World Tour Finals.

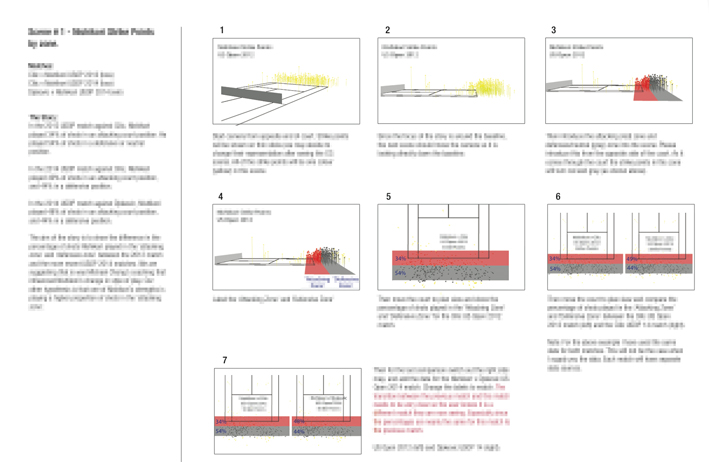
For each scene, storyboards and animation concepts were drafted in order to understand how the story would unfold.

Kei Nishikori storyboard

A typical storyboard which was used to prepare and support the animations. Text is blurred on purpose.

The following clip (2:14 min) from the documentary introduces the viewer to the millions of Hawk-Eye data points that were analyzed for the documentary, and how the data was used to identify trends and patterns in Nishikori’s game.

The video then goes on to compare Nishikori’s hit point location from his 2012 and his 2014 US Open matches against Cilic. One of Nishikori’s strengths under Chang is that he plays ‘up’ on the baseline, taking time away from his opponent. In 2012 before Chang, Nishikori played only 34% of shots 1 m either side of the baseline. We refer to this zone as the attacking zone. In 2014 against Cilic again at the US Open, Nishikori played 49% of his shots in the attacking zone.

Finally we graph Nishikori and Wawrinka’s shot speed trend at the 2014 US Open. Nishikori’s shot speed trended constantly upwards throughout the entire match, while Wawrinka’s trended downwards. This was a distinguishing feature of Nishikori’s game at the US Open.

The complete documentary can be viewed here.

The analysis of the Hawk-Eye data provided ‘scientific’ proof of Nishikori’s strengths and weaknesses. It was also clear during the analysis and cross validating the results against player interviews that the players and coaches don’t always have a clear understanding of why they won or lost a match. We were able to validate the many assumptions, or commentary about a match with the use of such data.

The producer’s primary goal was to tell a story that was backed by real data. The animations played a critical part in delivering the story and messaging. They allowed us to simplify the 1 million plus data points that were analyzed, crunched, and spat out. Unfortunately there is only 43 minutes of tape in the final cut, but there were many revealing patterns and trends identified that are no doubt valuable to tennis players, coaches and sports reporters. If you would like to know more please get in touch. But for now, as they say in show business – that’s a wrap!

Video’s copyright NHK. Analysis and images copyright GameSetMap. Do not share the contents of this webpage without permission. 

Building a Pair of Christmas Trees from Hawk-Eye Data

I want to send out a big thanks to everyone who has shown interest in what is going on at GameSetMap this year. 2014 has been a busy year, and the last couple of months have been super exciting. More news to follow about that in the New Year…

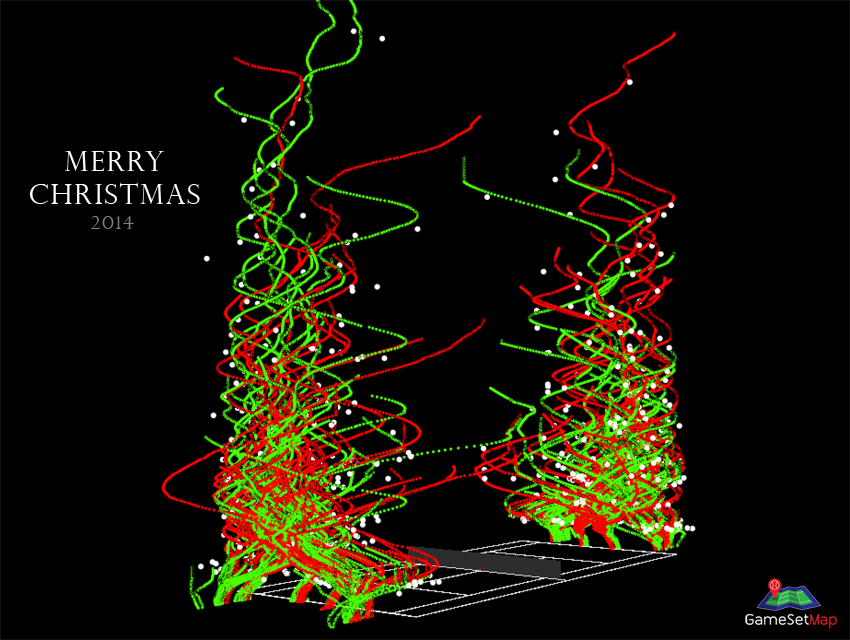
But for now I wanted to send all of you tennis lovers a christmas card made out of Hawk-Eye data! Just because I could!!

Hawk-Eye Data Christmas CardIt’s just a little bit of fun using player movement paths (the red and green lines) and player strike locations (the white points) from a match I was analysing recently. It was an attempt at creating a pair of Christmas Trees from the data. Kind of worked don’t you think?

Once again thanks for the support in 2014 and I look forward to sharing more insights into the wonderful world of geo tennis analytics!

Damien

Official WTA finals app likely to open up a can of worms

Today the Women’s Tennis Association (WTA) and SAP announced the launch of the official WTA Finals mobile app just in time for the BNP Paribas WTA Finals in Singapore – press release.

WTA Official AppThe app has been in progress for much of 2015 so I was happy to finally see SAP and WTA deliver on their promise of “taking the fan experience to the next level.”

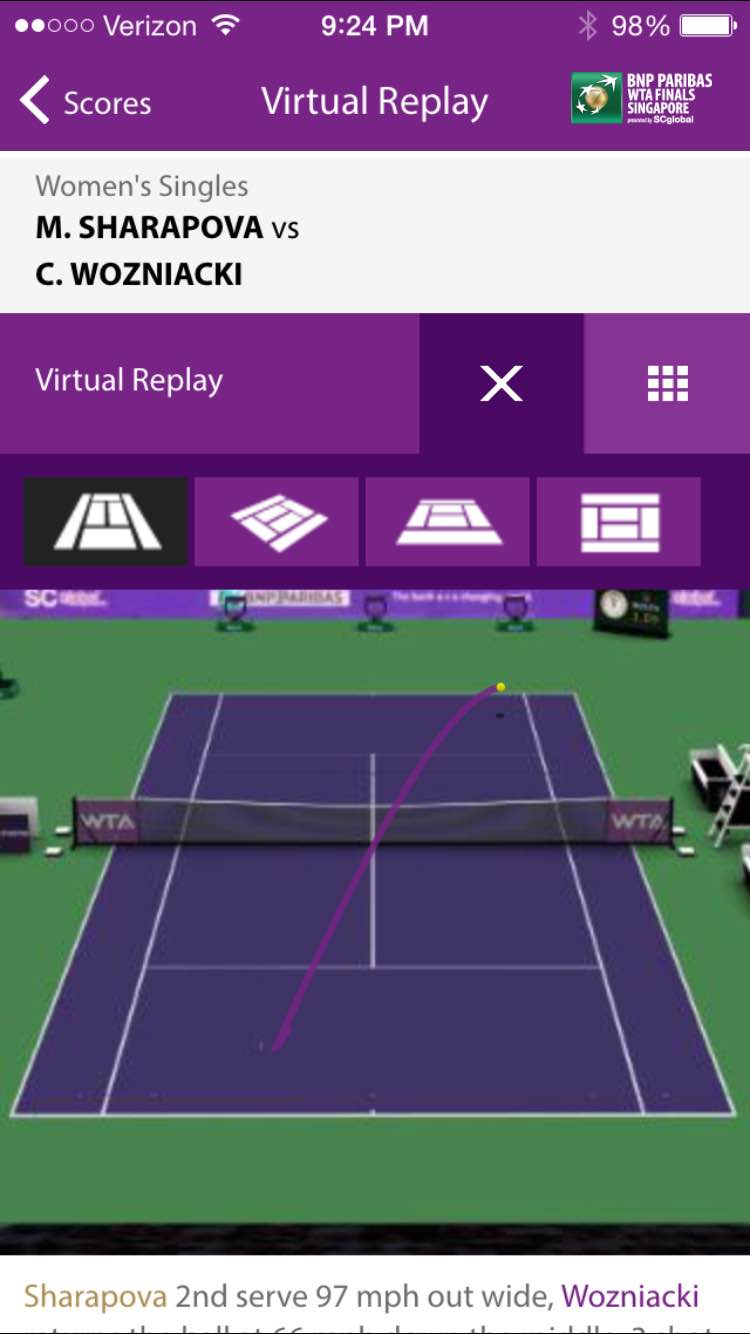
The app has all the usual features of a tennis app; live scores, news and videos, schedules, draws etc. But what makes this app “groundbreaking” is a feature called Virtual Replay where users can watch an animated point-by-point replay of the match unfolding right before their very eyes. It’s kind of cool to watch the ball trajectory animate over the net between the players (for what it’s worth). Unfortunately it’s not clear which player is playing at which end as the animation runs through. You will need to read the commentary of the point from below the animation to figure that out.
WTA Virtual Replay

The default view of the animation is a normal camera view (from one end of the court) but users have the ability to change the view to 3 other camera angles which is a nice touch.
IMG_0184

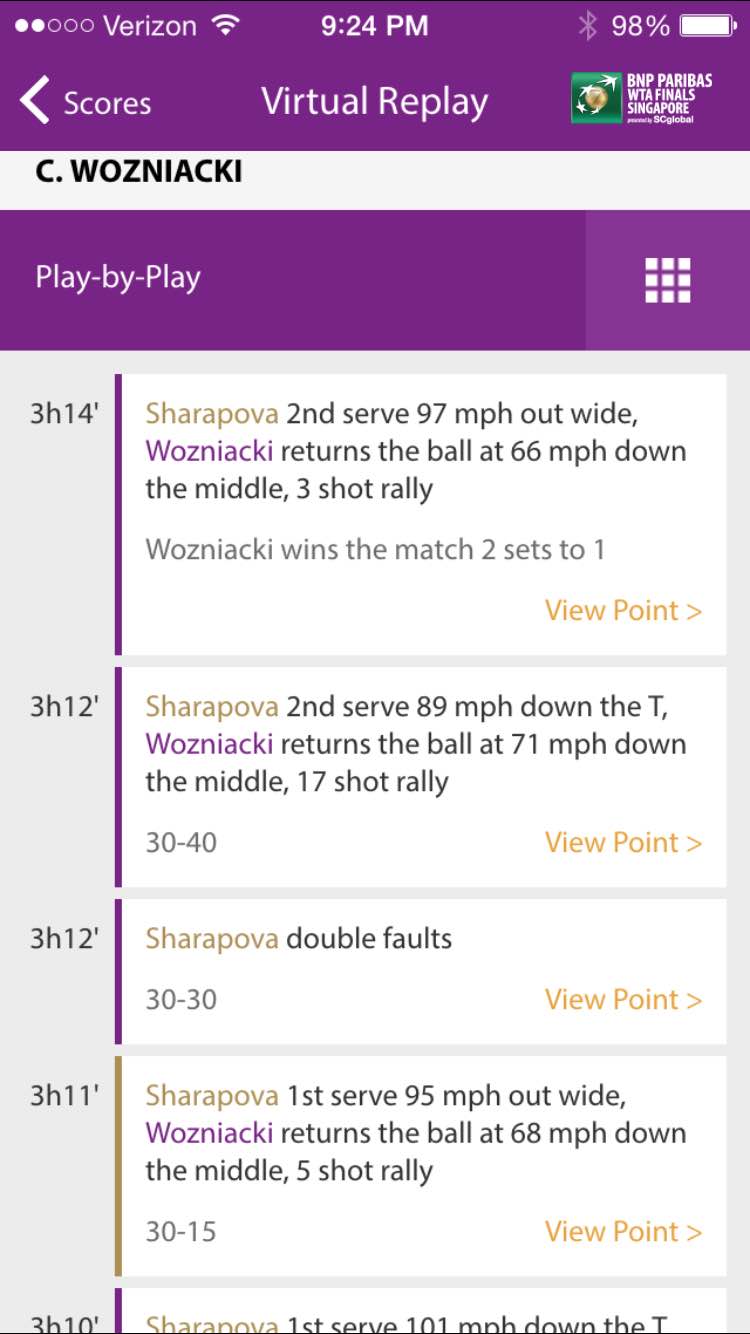
Users can then choose which point they want to watch from the point-by-point breakdown, which is a neatly organized commentary of each point from the match showing the point score, and key actions made by each player.

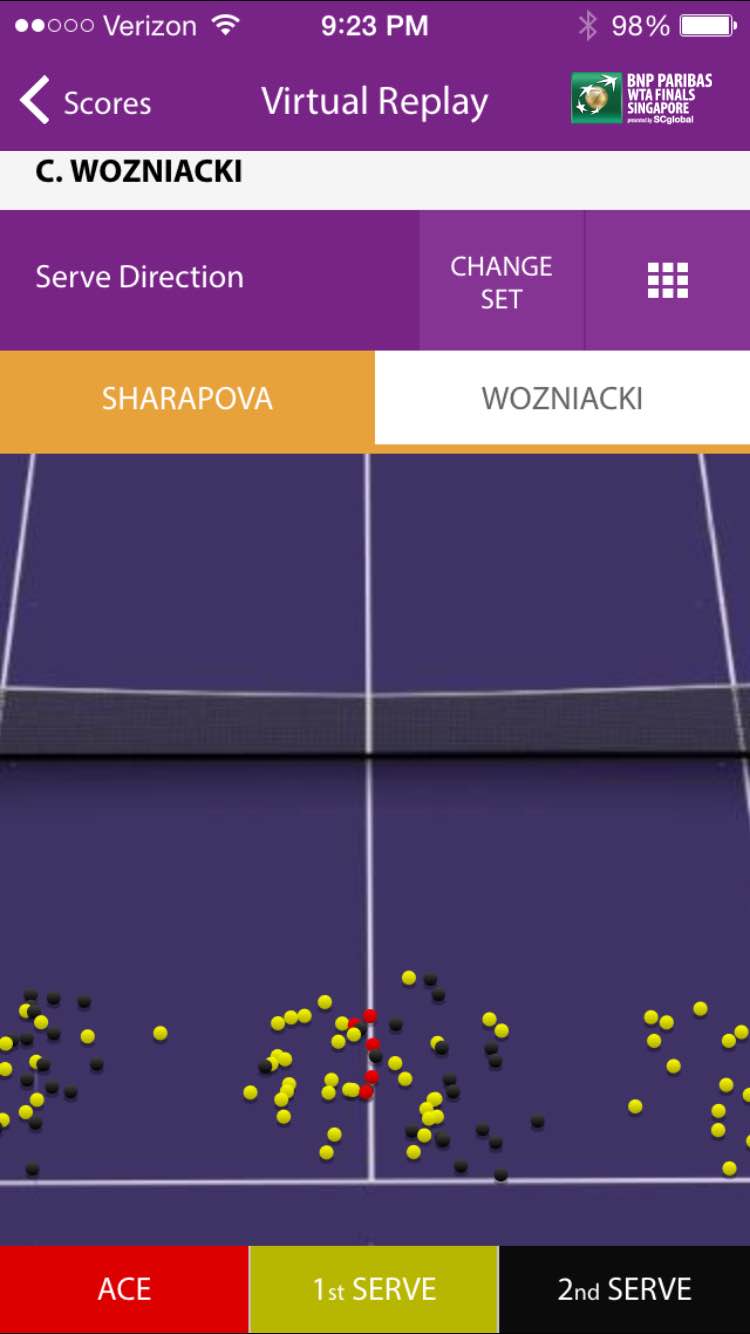
The app also includes additional visualisations like Serve Direction (below).
IMG_0180

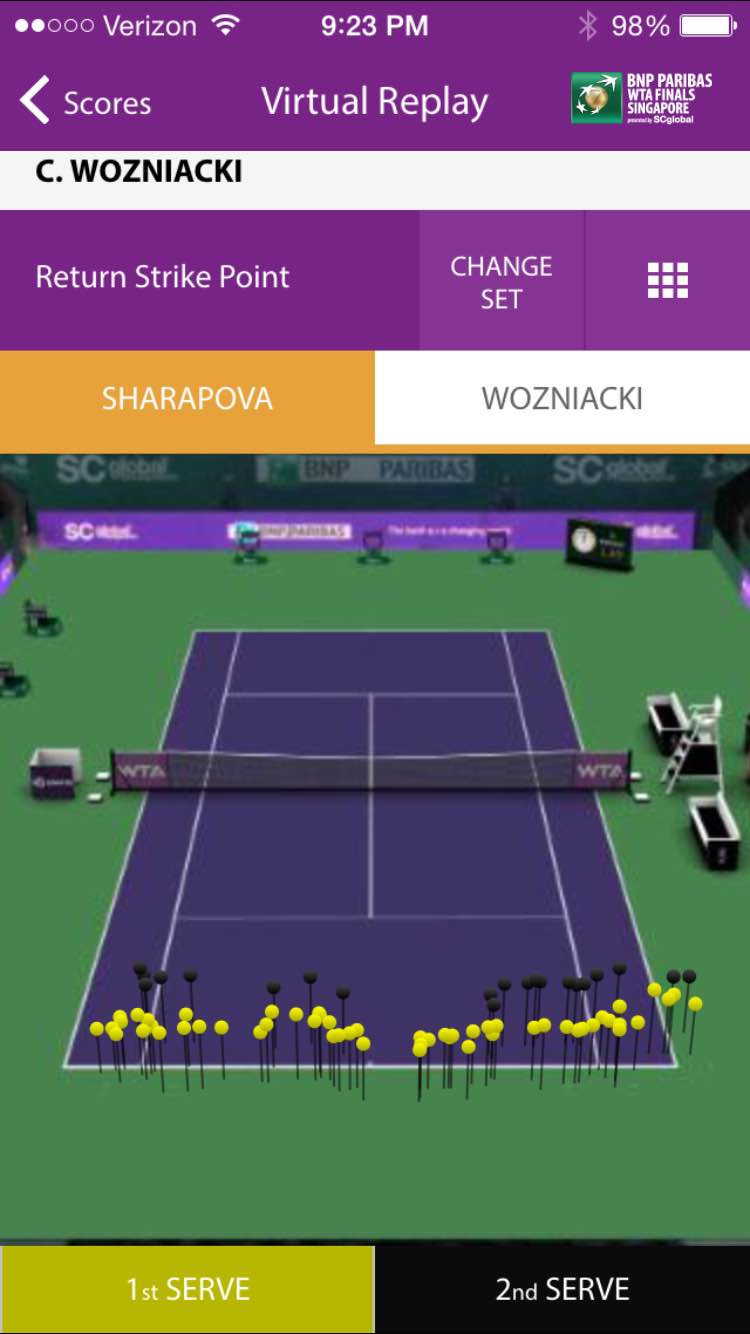
Return Strike Points

WTA App

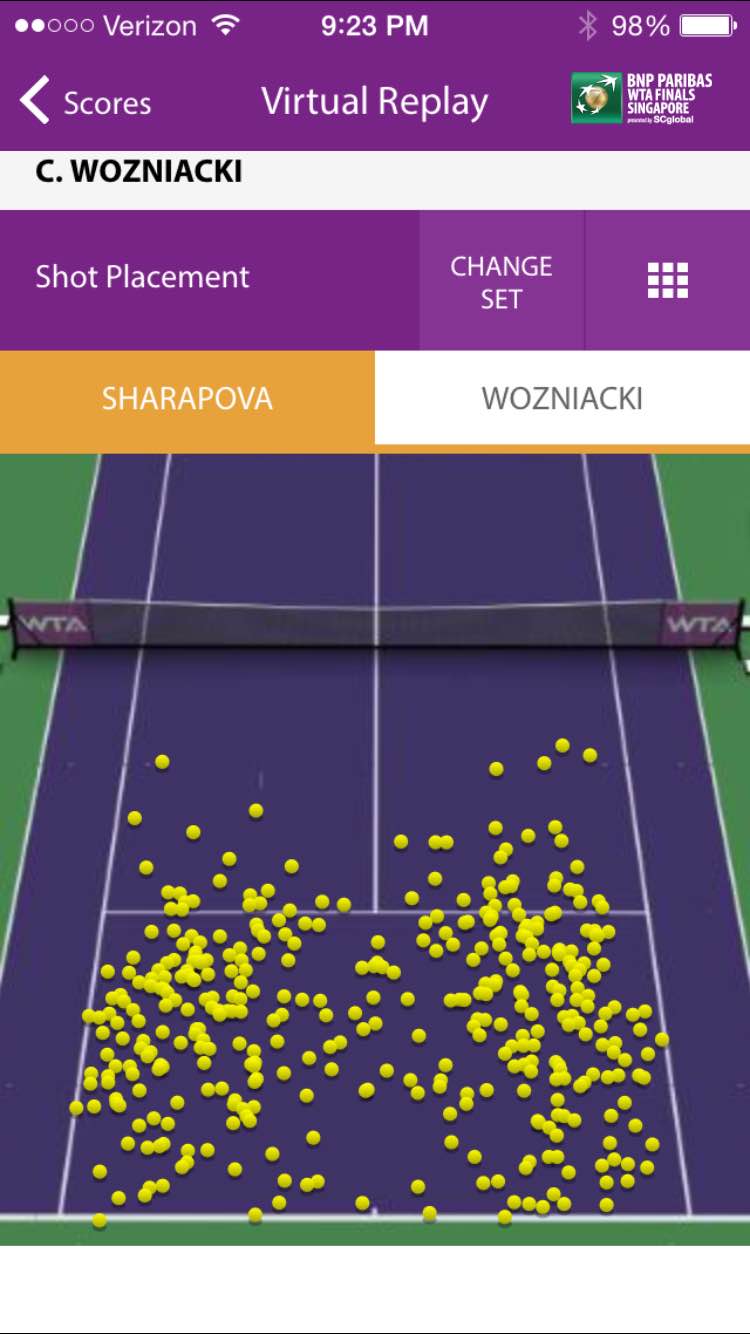
Shot Placement

WTA Shot Placement

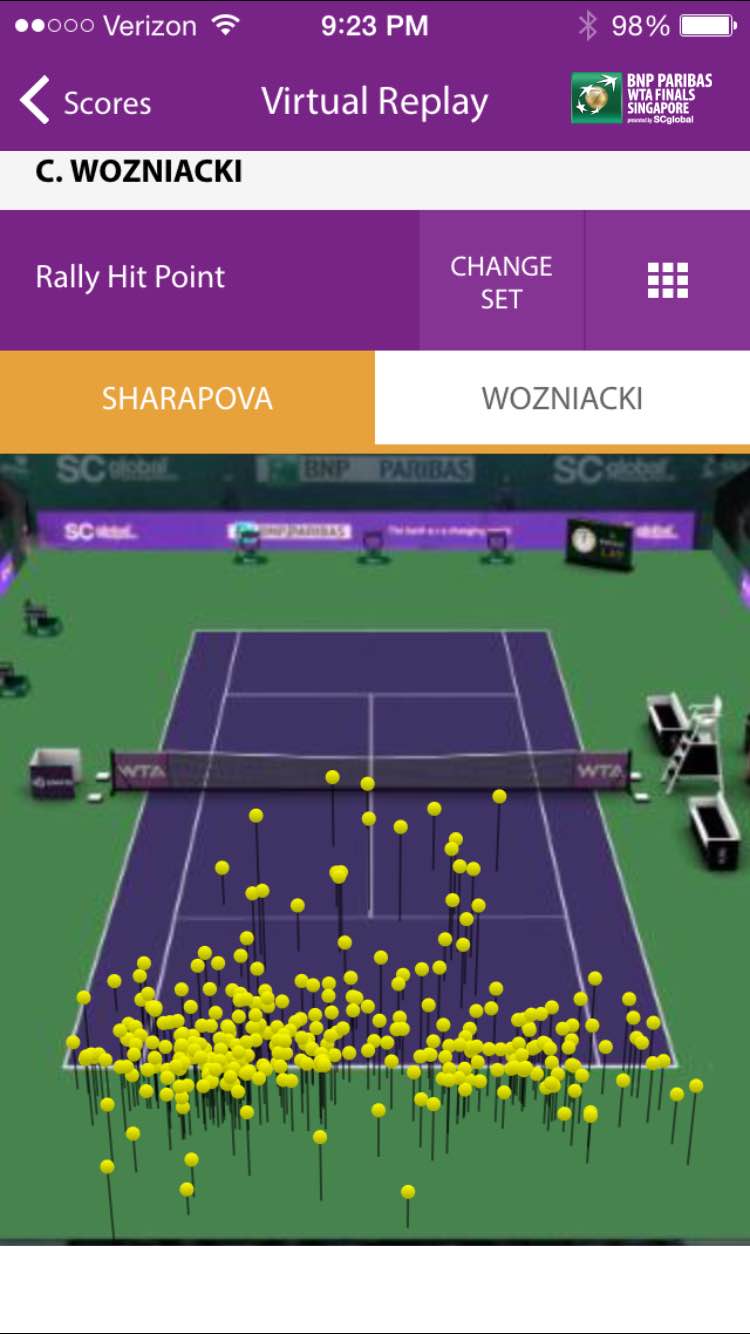
Rally Hit Point

WTA App

All of the visualizations allow you to switch between players, and you can change the Set you want to view at any time. It all makes for a very impressive mobile application, and is certainly light years ahead of any other tennis app I have seen. It is also no mean feat to package all of this content up in a very usable, and engaging mobile app that fans are sure to love and embrace.

So how useful is all of this? Well, to be honest we’ve kind of seen it all before. Hawk-Eye through their various relationships with TV Broadcasters like ESPN and the BBC have been publishing these types of visualizations for a number of years. Admittedly we have not had access to this level of information post match and in the palm of our hand before, so this is new ground definitely. But we are not really seeing anything new here.

The visualizations in the app unfortunately lack some valuable context in order to make them really useful for players, coaches and the fans. For example they are simply static representations of the data. You can’t query them (by touch), or filter them, or overlay one player’s points on another in order to perform any additional analysis. There is no significance attached to the data, like winners, unforced errors, big point plays etc. There is no way of knowing whether the patterns we see are expected, or a cause for alarm given the sate of the match, or past performances against this player. Perhaps we’ll see this kind of contextual information added in future releases. SAP and the WTA claim they have worked closely with the players to develop the app to their needs. However my feeling is most astute coaches and players will see these visualizations as nothing more than eye candy (for now).

As a tennis fan, and analyst of the game, the application naturally left me wanting more, and I suspect coaches and players will feel the same. What the WTA has effectively done is open up a big can of worms. The visualizations in the app leave so many questions unanswered, which is not untypical of a all-in-one app like this. But it does provide a wonderful insight into the potential of these kinds of visualizations. In order for players to really benefit from the true potential of this rich dataset from Hawk-Eye they are likely to still undertake independent analysis which dives much deeper in geographic patterns and tendencies than what we see here.

Hats off to the WTA for leading the way with this new-age tennis app. It has raised the bar and expectation going forward, and it definitely takes the mobile fan experience to a new level. I look forward to hearing what the players and coaches really think. My understanding is they will be given a more comprehensive app for on-court coaching, which may pack a few more tricks than what we see here. That may or may not be a good thing given visualisations like these tend to take time to digest, assess, and decide what action to take. This will be a new challenge for coaches, particularly in the heat of the battle. My sense is this kind of information will be primarily used post-match when emotions and the tension from a match have passed. It will also be interesting to see how the ATP respond over the coming months/years. Perhaps they too will partner with SAP to deliver a similar app for the mens tour if this takes off.

The WTA application was tested on an iPhone 6.

How to bend it like Federer

Roger Federer claimed his 23rd ATP World Tour 1000 Masters title on the weekend by beating Gilles Simon 7-6(6), 7-6(2) in Shanghai. Whilst this wasn’t Federer’s most memorable match of his career, he was able to get the job done when it mattered most. However, the match that everyone is still talking about is his semi-final win over Novak Djokovic. For it was Federer that turned back the clock by putting on a masterclass of serve and volleying.

Last night I pulled down some Hawk-Eye data from a match Federer played against Paul-Henri Mathieu back in 2012 at the Swiss Indoors. I ran a quick visualisation of a serve and volley point played by Federer to illustrate how Federer sets up his serve and volley points using a beautifully executed slice serve.

Federer Hawk-Eye Serve

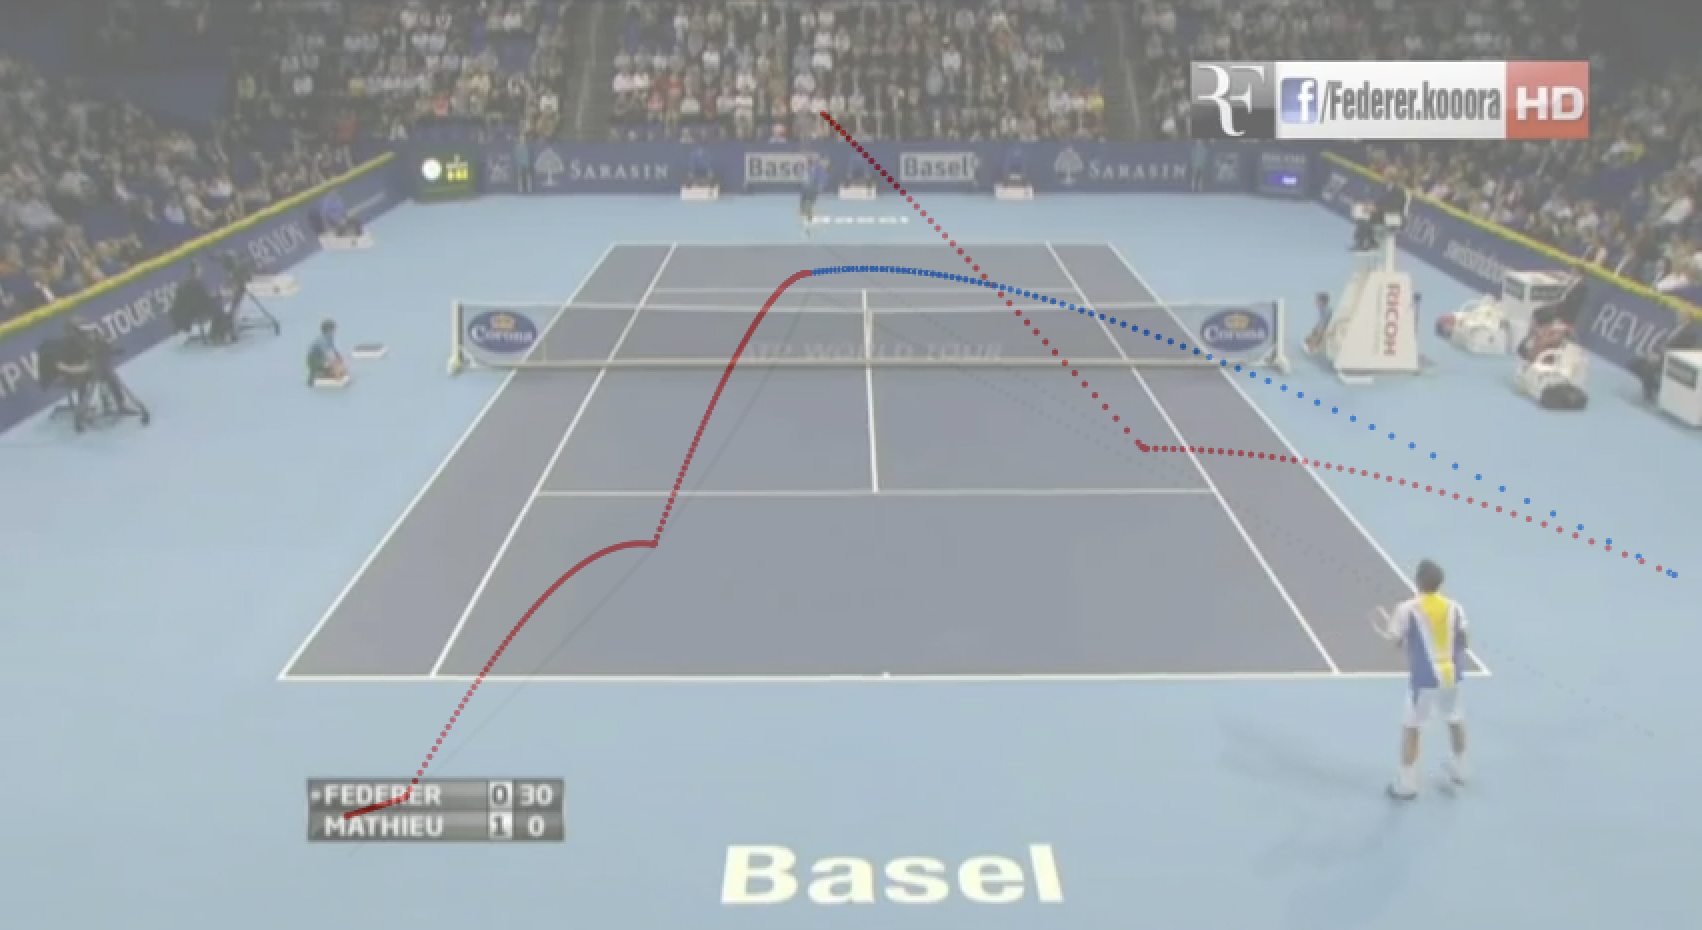
Figure 1: Federer v Paul Henri Mathieu, Swiss Indoors, 2012. Federer serving. Red lines are Federer. Blue line is Mathieu’s return of serve. Click to enlarge.

In this example Federer slices his serve out wide to Mathieu’s forehand, drawing Mathieu off court. Mathieu picks up the Federer serve (very well actually) and returns it right at Federer’s feet. Unfortunately for Mathieu, Federer makes a rather tricky half court volley look seemingly easily as he punches the Mathieu return into the open court to finish off the point.

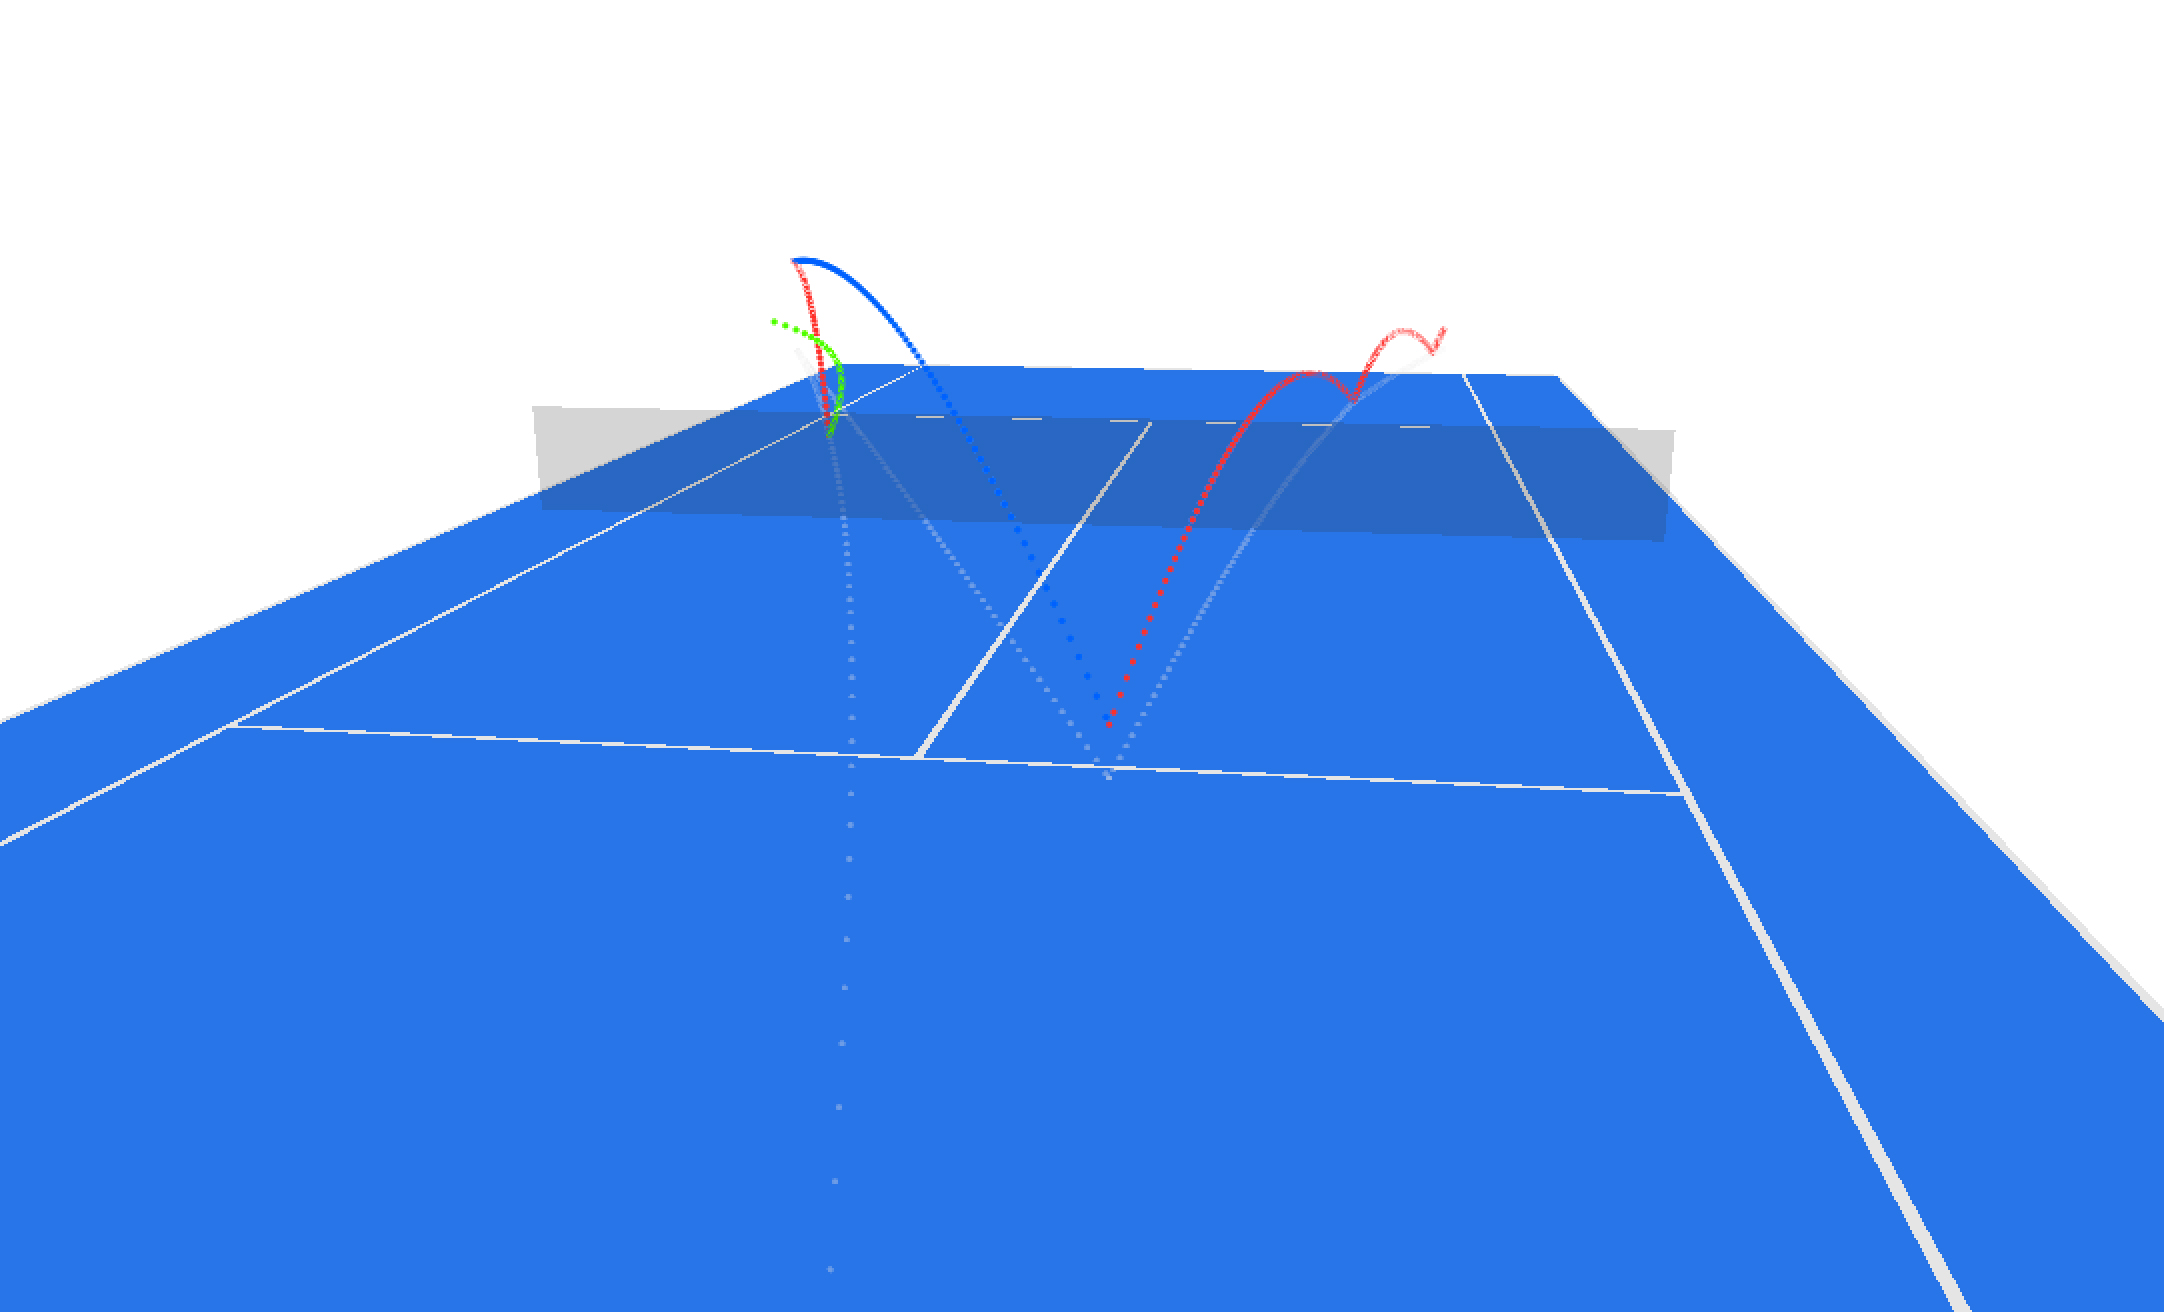
Federer Hawk-Eye visualisationFigure 2: Mathieu’s look off of the Federer racket. The red lines are Federer. Blue line is Mathieu serve return. Click to enlarge.

Let’s take a look at how Federer is using sidespin to shape the ball off his racket. Figure 2 gives you a first hand look at what Mathieu sees coming off of the Federer racket. The moment the ball leaves Federer’s racket the ball begins swinging away from Mathieu’s forehand pulling him off court and creating a negative court position for him. The shadow of the serve trajectory illustrates just how much curvature Mathieu has to deal with. Let’s take a look at this from Federer’s end of the court (see Figure 3).

Federer serve trajectory Hawk-EyeFigure 3: The green line is Federer’s serve trajectory off his racket. This particular serve was recorded at 172 km/h. Click to enlarge.

From Federer’s end the sidespin is even more evident. Take a look at the right to left movement of the ball as seen on the green line above. You will also notice how little margin of error there is as the ball crosses the net, this is a typical property of a sidespin serve. The lack of top spin means the serve doesn’t rip up-and-over the net, instead it’s slicing down towards the court more quickly which results in tighter clearance over the net. In order to generate this amount of sidespin players pull back their serve speed in order to get the racket head around the serve on impact. This first serve of Federer’s was hit at only 172 km/h and landed in an OK position in the service box. Had the location of the serve been closer to the sideline, the serve may have well been an ace, as the ball would have been too far off court by the time it got to Mathieu for him to get a racket on the ball.

Federer has never had the biggest serve on the tour, but his precision and work on the ball has caused many of his opponents a headache or two in their day. The sharp curve and heavy sidespin gives Federer an instant advantage in the point, and puts his opponents in an immediately poor court position. What this does is force the returner to come up with a great return (which in this case Mathieu did, but Federer was too classy in this exchange) otherwise the point is quickly over with a volley, or one-two play. Djokovic experienced the Federer serve in full flight on Saturday, with the Swiss maestro bending it around like Beckham (as they say!). To top it off Federer brought his soft hands to the court and played a number of exquisite volleys, giving Novak no chance of getting into the long grinding baseline rallies that he thrives on. Let’s hope we see more of this attacking serve volley game from Federer as the 2014 ATP season draws to a close!

Visualisations created using 3D ArcGIS.

An interview with Courtney Walsh at the US Open

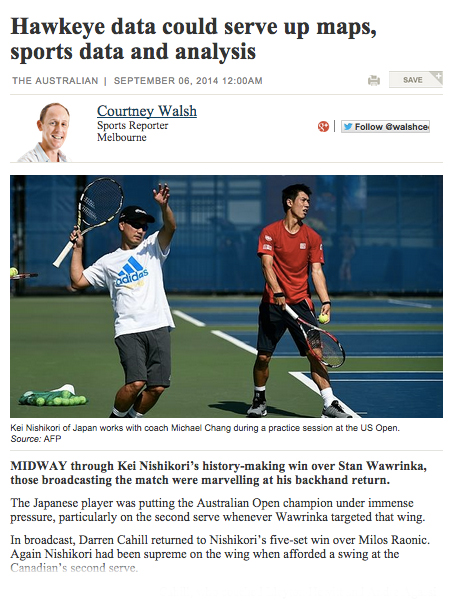
Recently I met with Courtney Walsh at the US Open. Courtney is a sports journalist at The Australian newspaper, specializing in tennis. He contacted me a while back about the work I was doing with Hawk-Eye data and suggested we meet up at the US Open. We talked about all things tennis, in particular the potential of Hawk-Eye and how it might influence player’s tactical preparation, training and post-game analysis. Courtney’s article titled “Hawkeye data could serve up maps, sports data and analysis” can be read here. Enjoy!

Hawkeye data could serve up maps, sports data and analysis

Mining Hawk-Eye data. It’s time to show the tennis world what they’re missing out on.

It’s been a little quiet around here recently, so I wanted to update you all on what’s been happening at Gamesetmap. The good news is there has been plenty of great work going on.

As many of you know I have been chasing down access to Hawk-Eye data for over 18 months now. One of my earliest posts on Gamesetmap outlined the challenges of getting access to the data. You can check out my post titled “Unlocking Hawk-Eye data: What it means for tennis, the ATP, WTA and ITF”.

Today, I’m please to announce that I now have access to a select number of matches, with the opportunity to purchase further matches in future. This is an enormous breakthrough for tennis, and for Gamesetmap!

Hawk-Eye tennis dataLet the Hawk-Eye data mining journey begin. A screen dump of the raw ball trajectory data from Hawk-Eye.

Generating the ball trajectory from the raw Hawk-Eye data was made possible with the help of Darren O’Shaughnessy. Darren runs a small consulting company in sports analytics and informatics called Ranking Software.

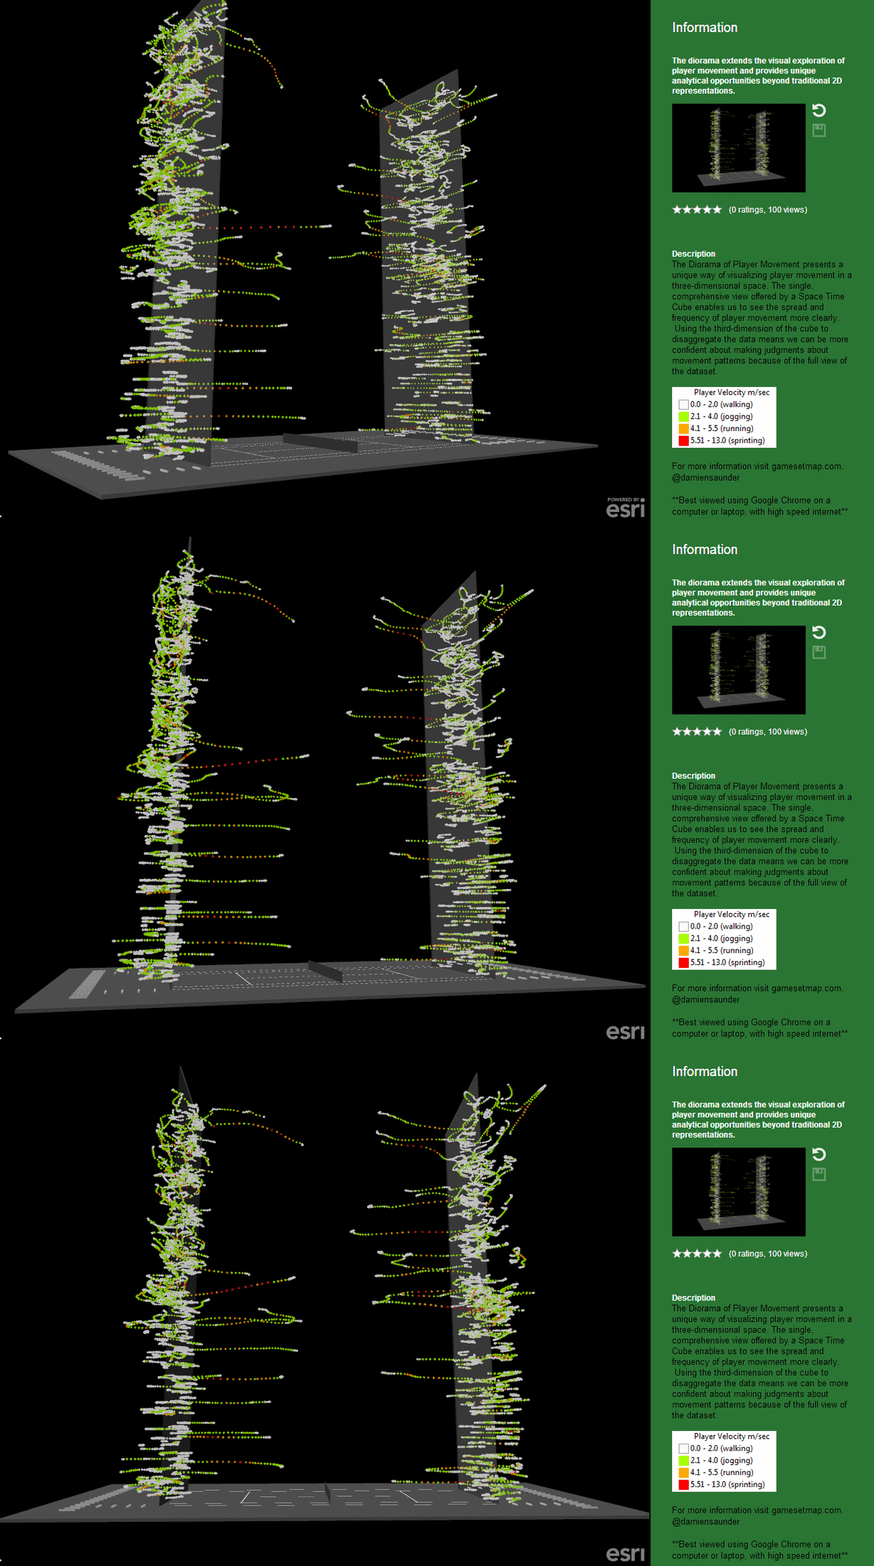
Late last year I created a 3D Diorama using Hawk-Eye player tracking data from the same matches (see below):

A Diorama of Player Movement in Sport

The two datasets (player tracking and ball trajectory) provide an insight into tennis matches that has rarely be seen before.

Stay tuned over the next few months as I dig through these fabulous datasets to uncover the spatial patterns that exist in tennis.

Visualisations created using 3D ArcGIS.