Late last year I received a call from the very talented crew at Hush in New York to help on a project they were building for the 2013 US Open and IBM. You can check out a video they put together to promote the work below.
The IBM Data Wall had three layers of interaction, Playground View, Simple View and Detail View. Each digital “tennis ball” represented a match and the wealth of data that every match produces, and sometimes even included predictions of the outcome.
My primary role on the project was to:
- contribute ideas and design sketches
- be a source of tennis knowledge
- contribute as source of interpretation of data
Sean Klassen in a recent article on the Communication Arts website had this to say about the project…
“Sports are chock-full of data enthusiasts, so it’s great to see IBM and the U.S. Open taking advantage of that fact with some of the most beautiful infographics I’ve ever seen.”
The full article by Communication Arts which reviews the application can be read here.
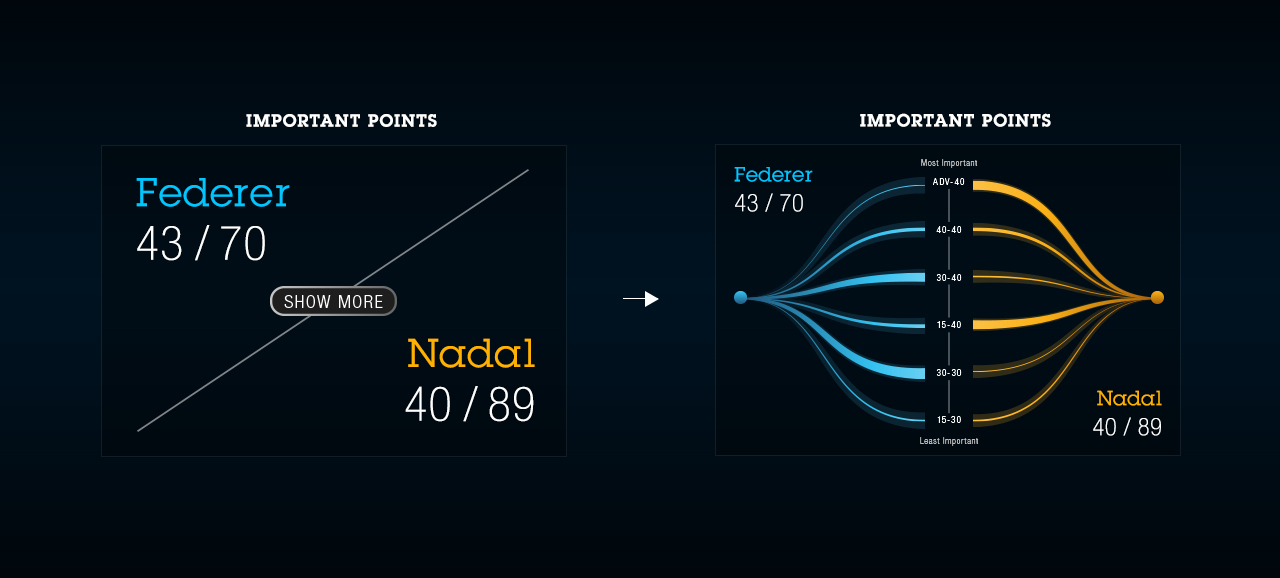
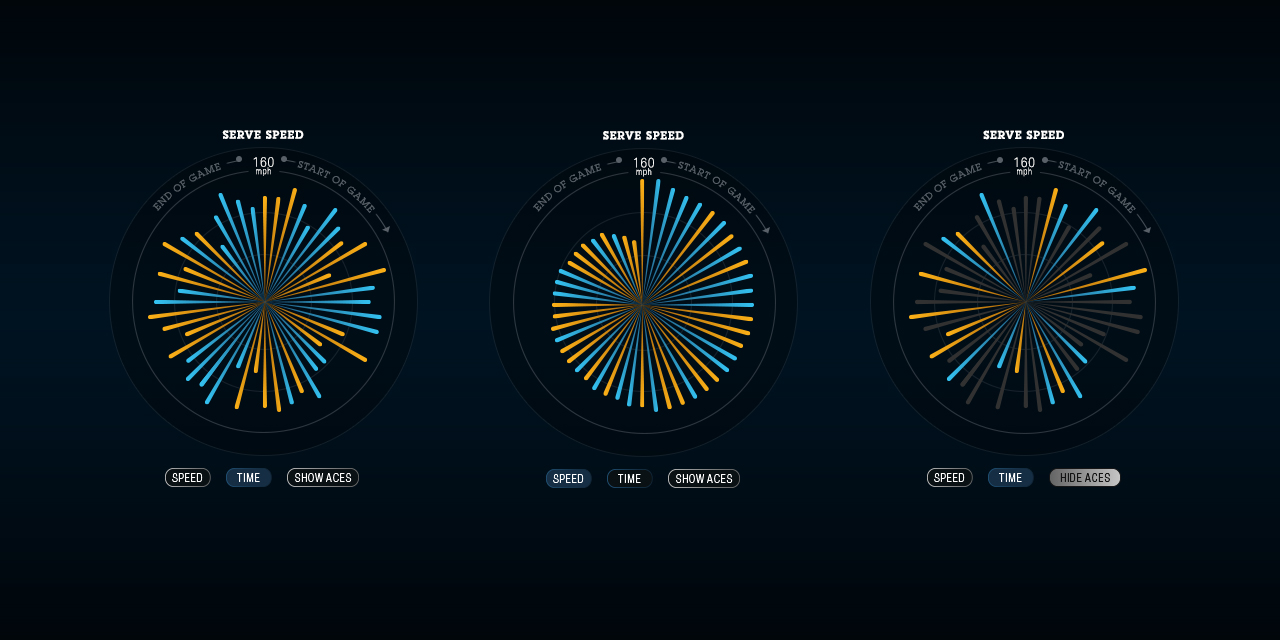
Some of my design sketches and ideas were transformed by the guys at Hush into these fabulous interactive infographics which were used in the final application (see below).
Source: http://heyhush.com/work/ibm/
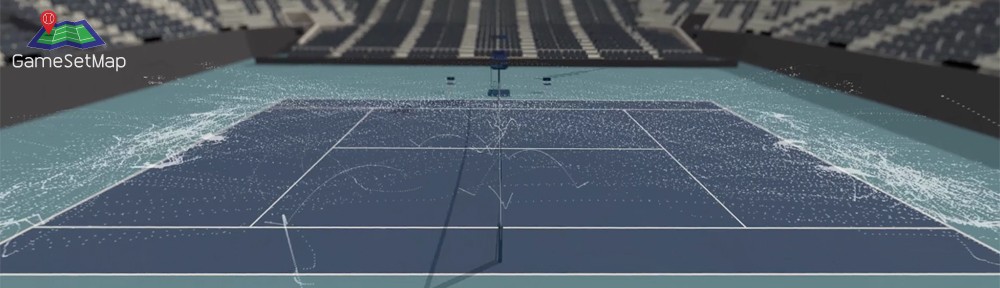
The main interface to exploring the Detail View ended up like this:

The guys at Hush had some fun with concept of an exploding tennis ball for the Playground View – they literally built this overnight!

A more comprehensive collection of screen shots from the application can be seen at Hush’s official website.
Enjoy!