(Part 1 of 3)
We have all been there, standing on the baseline when the coach places three cones in each service box and says “There’s your target, if you hit the cones you’ll get a free can of drink”. If you were like me, you rarely hit the cone, and if you did, it was more luck than anything else!
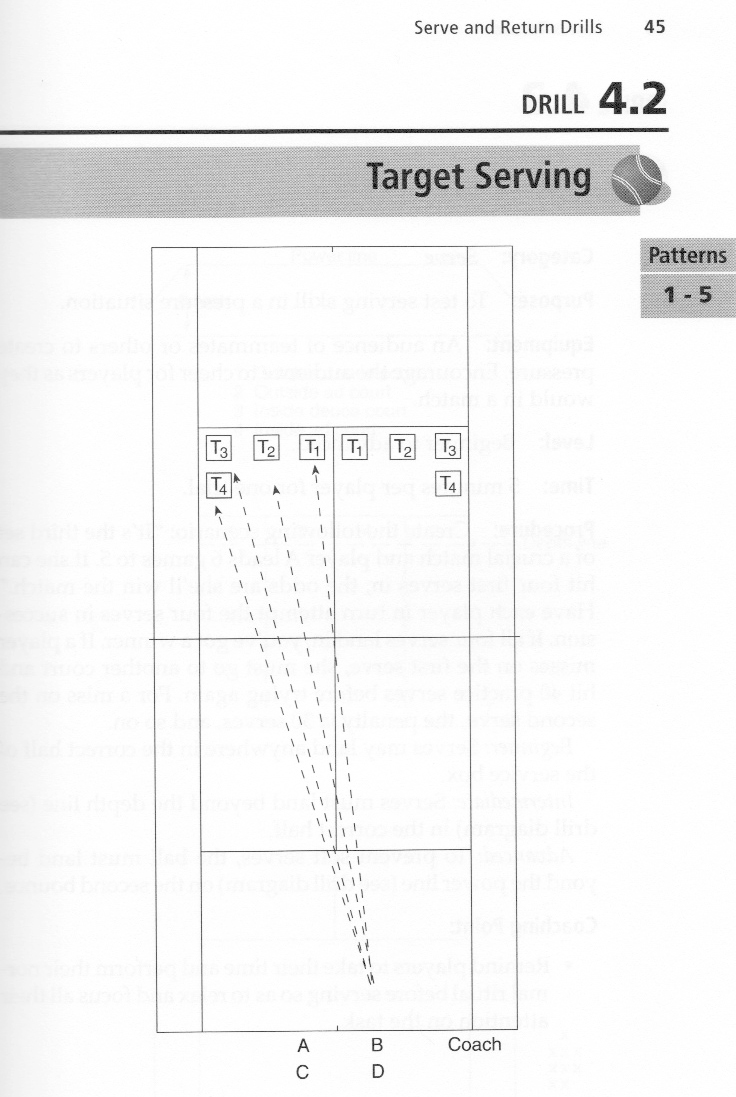
Coaches have been using these types of serving drills for many years. Why? Well, in order to develop a successful serve, you need to practice the placement of your serve. In the USTA book titled Tennis Tactics, Winning Patterns of Play, drill 4.2 (p 45) outlines four target zones in each service court to aim for (see Figure 1). It is in these zones where coaches place their cones to improve the serve placement of their players (and give away free drinks!).
Figure 1. The four recommended serve target zones in each service court as recommended by the USTA. Down the T (T1), a body serve (T2), a wide serve (T3) and short-ish out-wide serve (T4). Source: Tennis Tactics, Winning Patterns of Play, USTA.
Given the continuous emphasis on serve placement I set out to run a simple analysis to see who was the more ‘accurate’ server, the Big Boys (professional players) or the School Boys (college level players)? Included in this analysis are Roger Federer and Andy Murray representing the Big Boys, and the School Boys (whom shall remain nameless) are from the NCAA Division 1 tennis competition.
Some Context:
- Murray defeated Federer: 6-2, 6-1, 6-4
- School Boy A defeated School Boy B: 6-1, 6-1
Total number of serves hit by each player:
School Boy A: 58 School Boy B: 54 Federer: 95 Murray: 111
Total number of serves hit IN:
School Boy A: 44 (76%) School Boy B: 45 (83%) Federer: 78 (82%) Murray: 86 (77%)
Total number of serves hit OUT:
School Boy A: 14 (24%) School Boy B: 9 (17%) Federer: 17 (18%) Murray: 25 (23%)
In order to determine which player landed the highest percentage of balls in the four USTA zones (and therefore could claim they were the most accurate server!) I ran a simple select by location algorithm between each serve bounce and the four target zones in each service court. This enabled me to very simply return a count of how many balls landed in each box, for each player. Figure 2 shows the results of the selection.
Figure 2. The percentage of serves that landed in the USTA defined target zones for each player.
Surprised? Most of us would expect the Big Boys to place a higher percentage of their serves in the target zones than the School Boys right? However the results showed that School Boy A landed 15 out his 58 (26%) serves into the target zones, making him arguably the most ‘accurate’ server of the four players. School Boy B closely followed with 12 out 58 (22%). Murray was next up, landing 23 of 111 (21%) serves into the boxes, while Federer brought up the rear with only 16 out of his 95 (17%) serves landing in the boxes.
Accuracy: If we loosely define accuracy as being how close a measured value is to an actual value, where the actual value are the USTA target zones, then we can with some caution claim the School Boys out served the Big Boys in the accuracy department. Hard to believe I know.
But wait a minute, what if the Big Boys weren’t actually aiming for the USTA target zones, and instead were aiming outside of those zones? Perhaps they were aiming for the lines, which are outside the USTA defined target areas but still legally within the service court? What would the results look like if we extended the target zones further towards the lines? Let’s see…
Playing the Lines
You could argue that the service line is the optimum position for the placement of your serve, and that the corners of each service box are the ultimate targets. However targeting the lines brings a higher degree of risk, and a lower margin or error. Which is why coaches & the USTA don’t recommend us amateurs to go-for these targets every time! However at the top level where the Big Boys play, where there is so much on the line and so little margin for error (in all facets of the game) they are more likely to take the risk. By sending their serves as close to the lines as possible they give themselves a greater chance of setting up the point in their favor. We would also expect that they are more likely to consistently execute a higher level of accuracy, given their higher-level skill set. We shall see…
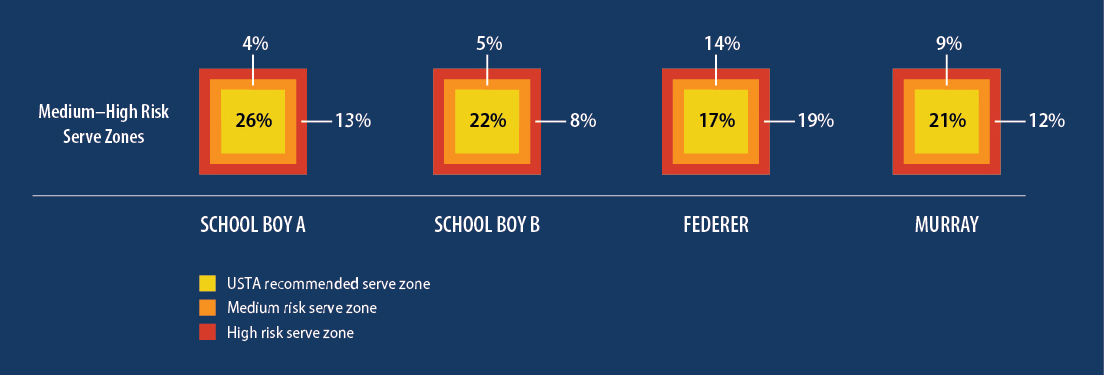
In order to test this I added two more 12.5cm (4.7 inch) wide target zones around the original USTA target zones. I call these Medium and High risk zones, where the High risk zone abuts and includes the service lines. By running the selection again using these two extra zones we will see who is taking the risk and pushing their serve towards the lines more, the School Boys or the Big Boys?
Figure 3. The percentage of serves that landed in the two additional High and Medium risk serve zones for each player. The width of each additional zone is 12.5cm (4.7 inches) (roughly twice the width of a tennis ball). In the second part of this blog we will see the spatial spread of serves across all target zones and all services boxes.
Figure 3 starts to tell a different story. By moving the target Federer was now clearly winning the most accurate server competition, landing 13 (14%) serves in the medium risk zone, and 18 (19%) in the high-risk zone. Murray’s success in these zones was a littler lower than Federer, with 10 (9%) for the medium risk zone, and 13 (12%) in the high-risk zone. School Boy A scored, 3 (4%) in the medium risk zone, and 5 (13%) in the high risk zone, while School Boy B scored, 2 (5%) and 7 (8%).
Clearly Federer was able to consistently pop more serves in the high-risk zones than any of the other three players. This would suggest that the Fed is arguably the most accurate server of the bunch? Most commentators of the game are unlikely to argue with that statement, but of course it depends on where the target is and where the players are aiming! School Boy A has every right to claim he is the most accurate server given he landed the highest proportion of his serves in the USTA target zones.
Some Further Ponderings
Given that each of the four USTA target zones in each service box are roughly 0.75m (2.46 ft) square I am surprised that the Big Boys are not landing a higher percentage of serves in these areas. No disrespect to the School Boys, they aren’t playing NCAA Level 1 tennis for no reason, but I expected the professional players to have a higher percentage of serves land in the target zones than the School Boys. I also expected Federer and Murray to land more serves in the higher risk zones. The results showed this was partly the case. Murray’s numbers in these zones are a little surprising given he swept aside Federer in straight sets on that day.
Perhaps at the highest level, simply aiming your serve at the USTA zones is not enough. Maybe the margin is too great. And in doing so you make life a little too easy for the returner?
So why do the School Boys have such a high percentage of serves in the USTA zones (compared to the Big Boys)? Is it because they serve with less speed and spin, therefore allowing them to slow things down and hit the ‘safe’ targets? Perhaps at this level, the players are taught to play the percentages? Perhaps their skill level forces them to do so?
The School Boys will no doubt develop their serving skills, and pop more serve speed and aggressive ‘kick’ on the ball as they mature. Being able to maintain that accuracy as they increase their serve speed and spin will be on ongoing player development challenge.
It is worth noting that each School Boy in the study served just over 50 times in their match, less than half that of Federer and Murray. Would they be able to maintain their high serve percentage into the USTA zones over a longer match where they may be required to serve 100+ serves? Would we see the same consistency, or could we expect it to see it drop off?
So what do these figures mean, if anything? What if I miss the USTA zones by a ball width or two? Am I still an accurate server? What if I’m only a little bit too short, or a little bit too central to the service box on my serve? Will I still win the same number of points if I’m a few centimeters or inches wide of the mark?
In part 2…
In the second part of this three-part blog I will endeavor to determine if there is a positive relationship between serve position, and outright success. I’ll explore if it’s possible to determine if the game of serving is really about a few centimeters or inches here and there? And in part 3 we will answer the most important question of all, who takes home the most free drinks!
Note: This study only looked at a very small sample of data from all players, so we need to be careful about making gross assumption based on the findings.


