How to bend it like Federer

Roger Federer claimed his 23rd ATP World Tour 1000 Masters title on the weekend by beating Gilles Simon 7-6(6), 7-6(2) in Shanghai. Whilst this wasn’t Federer’s most memorable match of his career, he was able to get the job done when it mattered most. However, the match that everyone is still talking about is his semi-final win over Novak Djokovic. For it was Federer that turned back the clock by putting on a masterclass of serve and volleying.

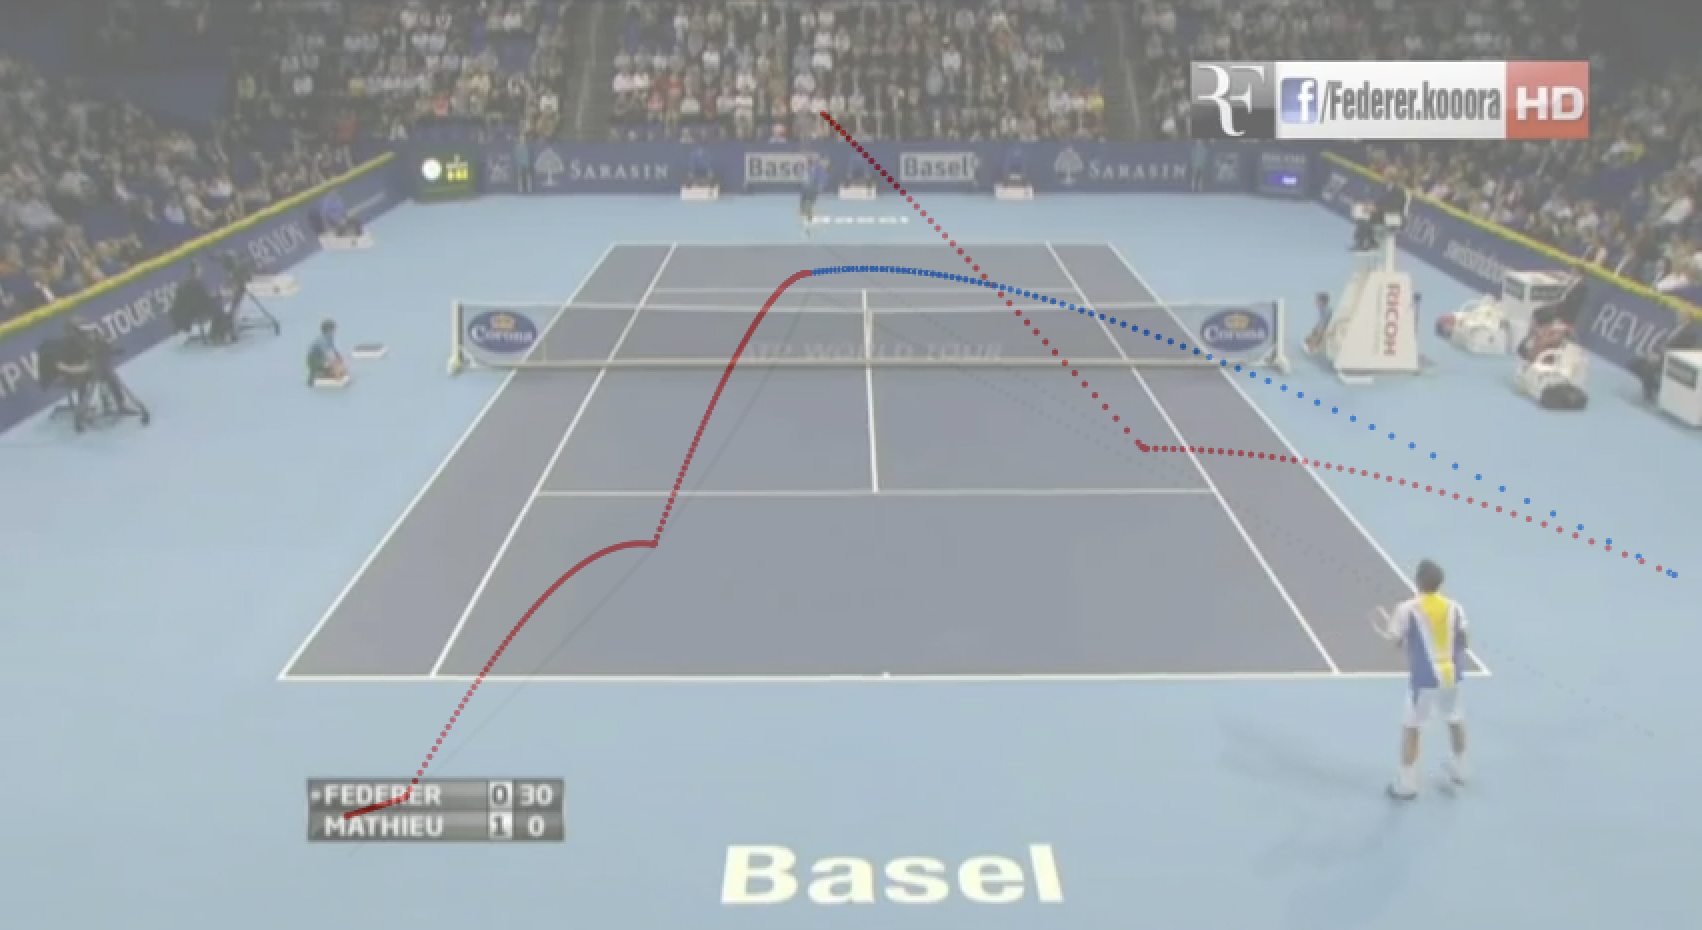
Last night I pulled down some Hawk-Eye data from a match Federer played against Paul-Henri Mathieu back in 2012 at the Swiss Indoors. I ran a quick visualisation of a serve and volley point played by Federer to illustrate how Federer sets up his serve and volley points using a beautifully executed slice serve.

Federer Hawk-Eye Serve

Figure 1: Federer v Paul Henri Mathieu, Swiss Indoors, 2012. Federer serving. Red lines are Federer. Blue line is Mathieu’s return of serve. Click to enlarge.

In this example Federer slices his serve out wide to Mathieu’s forehand, drawing Mathieu off court. Mathieu picks up the Federer serve (very well actually) and returns it right at Federer’s feet. Unfortunately for Mathieu, Federer makes a rather tricky half court volley look seemingly easily as he punches the Mathieu return into the open court to finish off the point.

Federer Hawk-Eye visualisationFigure 2: Mathieu’s look off of the Federer racket. The red lines are Federer. Blue line is Mathieu serve return. Click to enlarge.

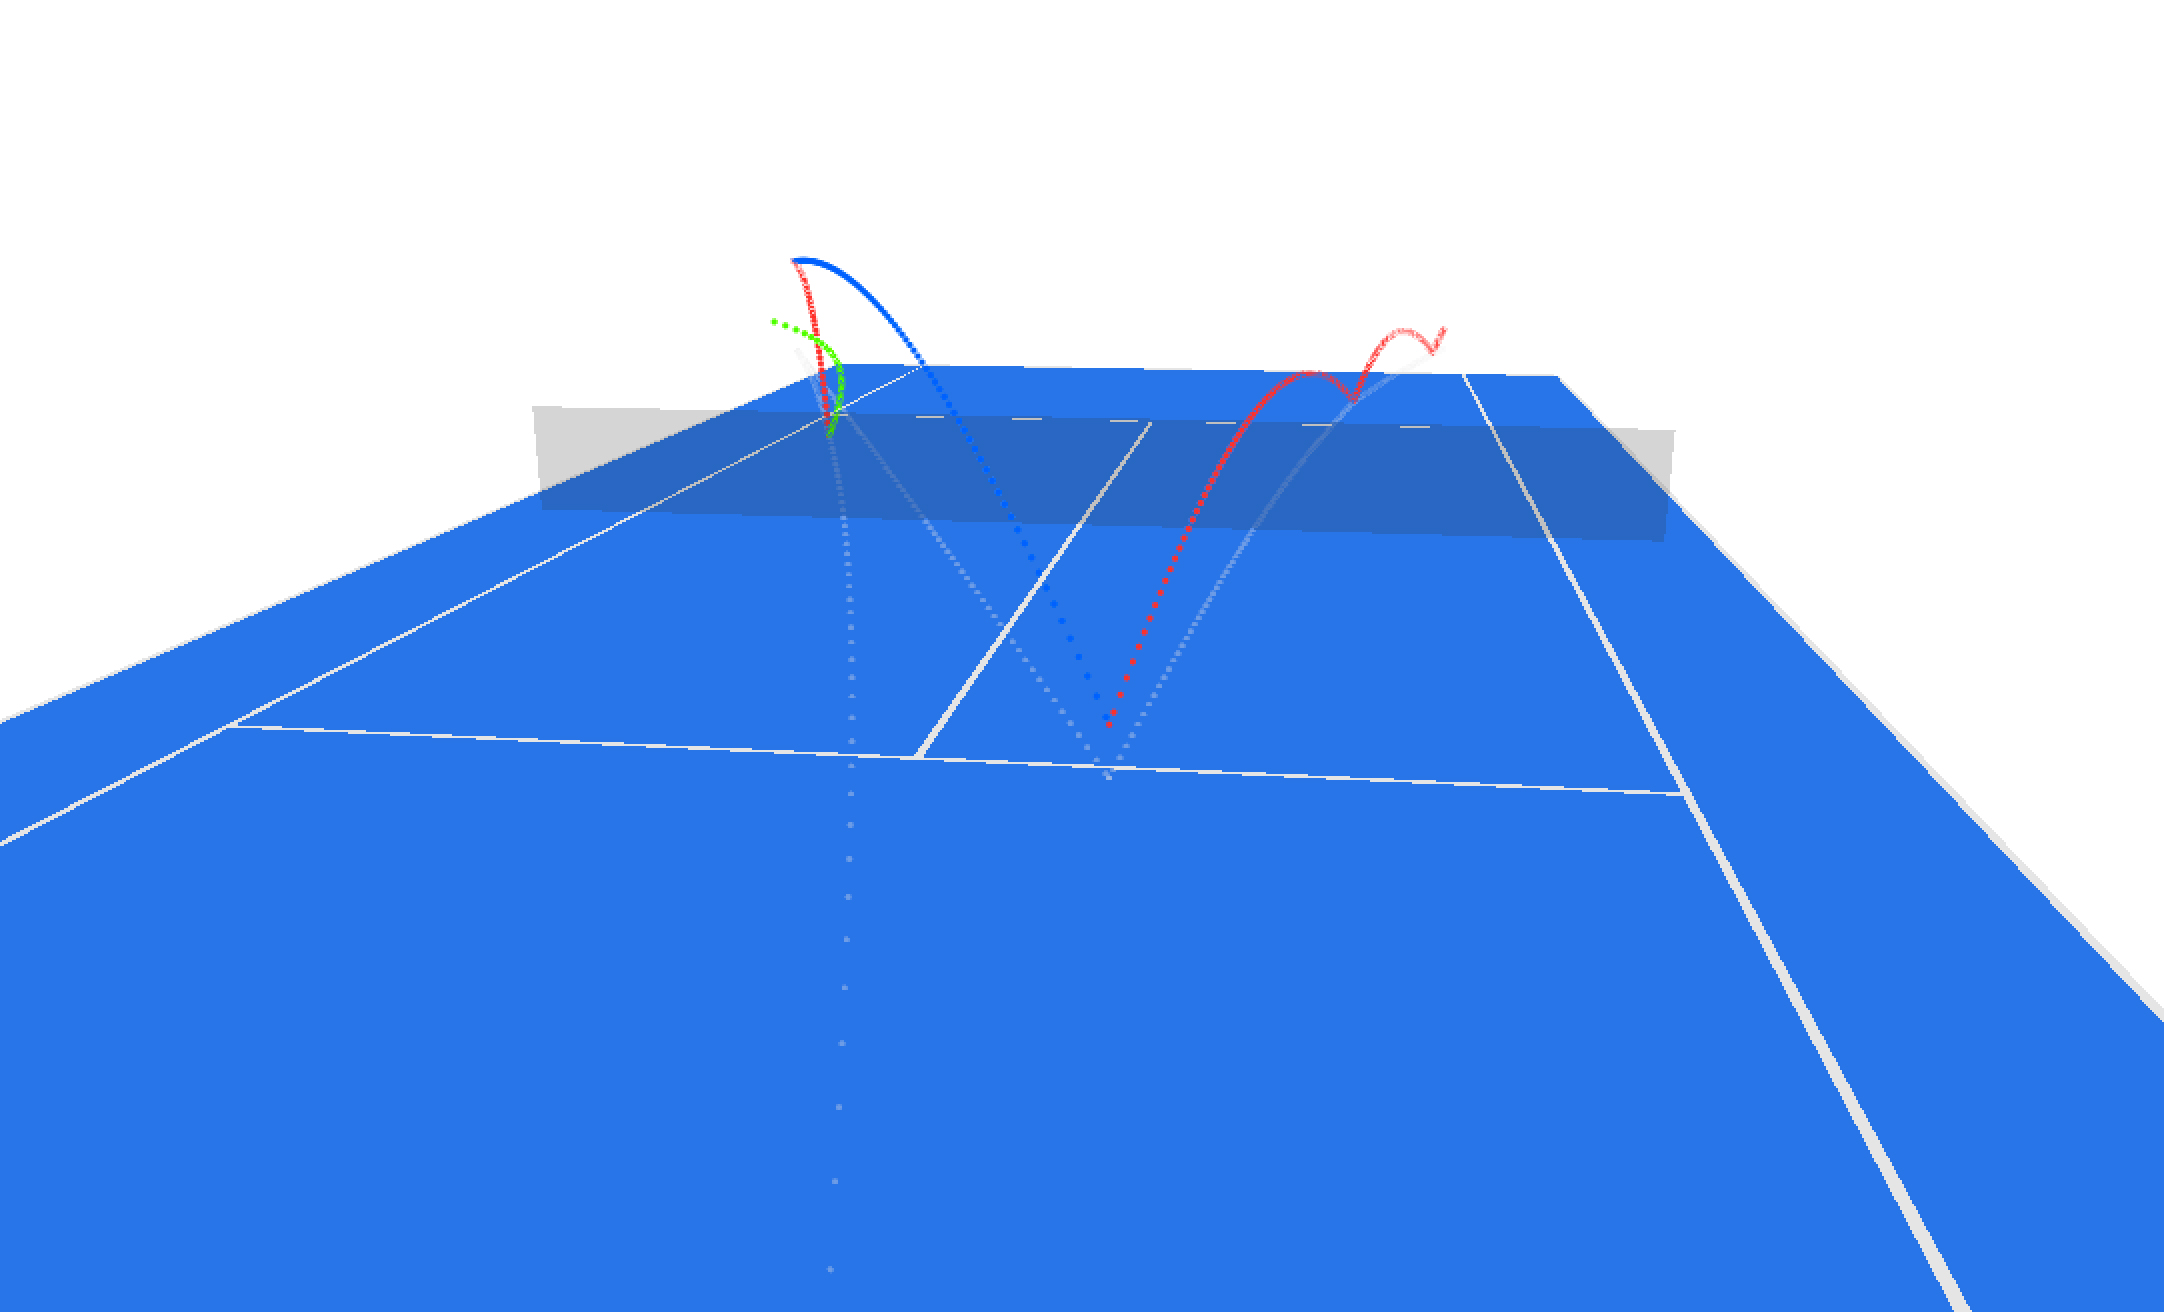
Let’s take a look at how Federer is using sidespin to shape the ball off his racket. Figure 2 gives you a first hand look at what Mathieu sees coming off of the Federer racket. The moment the ball leaves Federer’s racket the ball begins swinging away from Mathieu’s forehand pulling him off court and creating a negative court position for him. The shadow of the serve trajectory illustrates just how much curvature Mathieu has to deal with. Let’s take a look at this from Federer’s end of the court (see Figure 3).

Federer serve trajectory Hawk-EyeFigure 3: The green line is Federer’s serve trajectory off his racket. This particular serve was recorded at 172 km/h. Click to enlarge.

From Federer’s end the sidespin is even more evident. Take a look at the right to left movement of the ball as seen on the green line above. You will also notice how little margin of error there is as the ball crosses the net, this is a typical property of a sidespin serve. The lack of top spin means the serve doesn’t rip up-and-over the net, instead it’s slicing down towards the court more quickly which results in tighter clearance over the net. In order to generate this amount of sidespin players pull back their serve speed in order to get the racket head around the serve on impact. This first serve of Federer’s was hit at only 172 km/h and landed in an OK position in the service box. Had the location of the serve been closer to the sideline, the serve may have well been an ace, as the ball would have been too far off court by the time it got to Mathieu for him to get a racket on the ball.

Federer has never had the biggest serve on the tour, but his precision and work on the ball has caused many of his opponents a headache or two in their day. The sharp curve and heavy sidespin gives Federer an instant advantage in the point, and puts his opponents in an immediately poor court position. What this does is force the returner to come up with a great return (which in this case Mathieu did, but Federer was too classy in this exchange) otherwise the point is quickly over with a volley, or one-two play. Djokovic experienced the Federer serve in full flight on Saturday, with the Swiss maestro bending it around like Beckham (as they say!). To top it off Federer brought his soft hands to the court and played a number of exquisite volleys, giving Novak no chance of getting into the long grinding baseline rallies that he thrives on. Let’s hope we see more of this attacking serve volley game from Federer as the 2014 ATP season draws to a close!

Visualisations created using 3D ArcGIS.

Pinpointing the serve. Who missed, and by how much.

(Part 3 of 3)

In the final part of this three part series, I determine who picks up the most free drinks as a result of hitting the centre of the USTA target zone, and by how much. I also extend the analysis to see how much each player missed the ‘optimum’ serve locations.

Who picks up the most free drinks?

For a bit of fun let’s see who would have picked up the most free drinks by hitting the ‘imaginary’ cone in the center of each target zone. We know coaches run this drill with their players, so let’s see how well each player fared in a match environment. Let’s assume the cone is 20 cm in diameter.

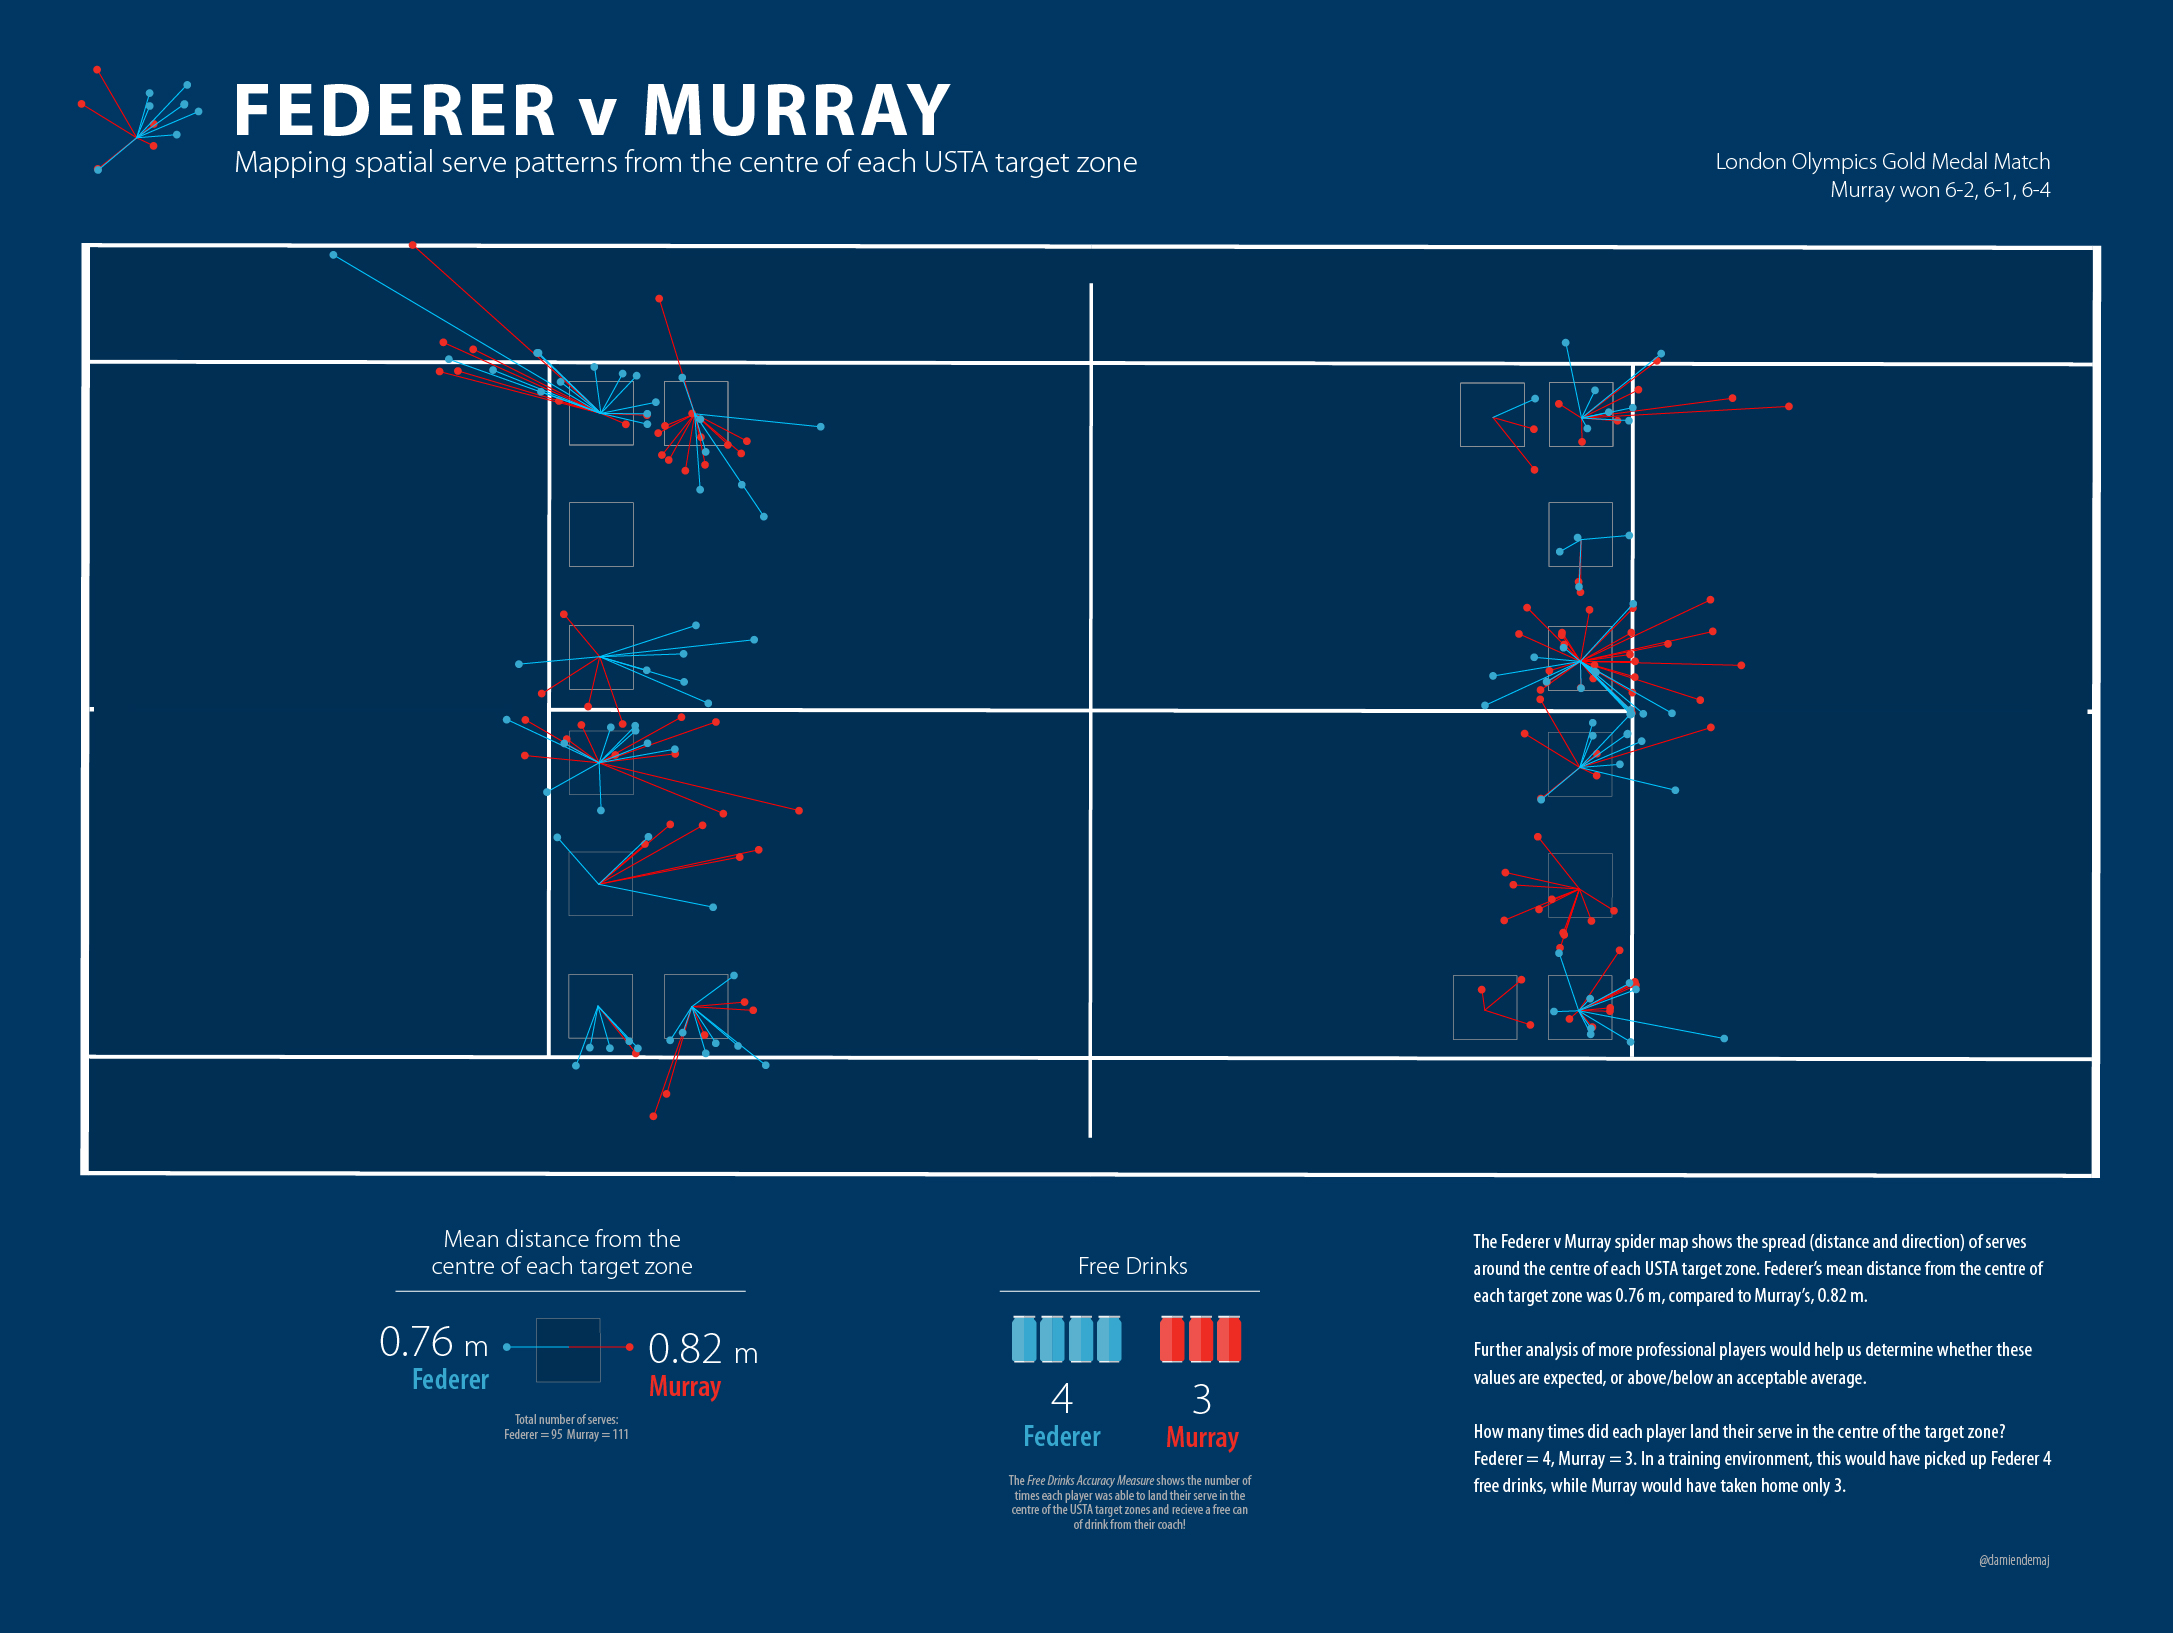
Federer Murray Serve Map Spider DiagramFigure 1. Federer v Murray. Mapping spatial serve patterns from the centre of each target zone. (click to enlarge)

The results show us that Federer picked up 4 free drinks, while Murray picked up only 3.   I don’t feel too bad since each player hit 100 or so serves each. That’s a pretty poor strike rate given these guys are best players in the world!

Each player missed the target by almost the same amount. Federer was on average     0.76 m from the centre of the each target  zone, while Murray was out by an average of 0.82 m.

Let’s take a look at the School Boys…

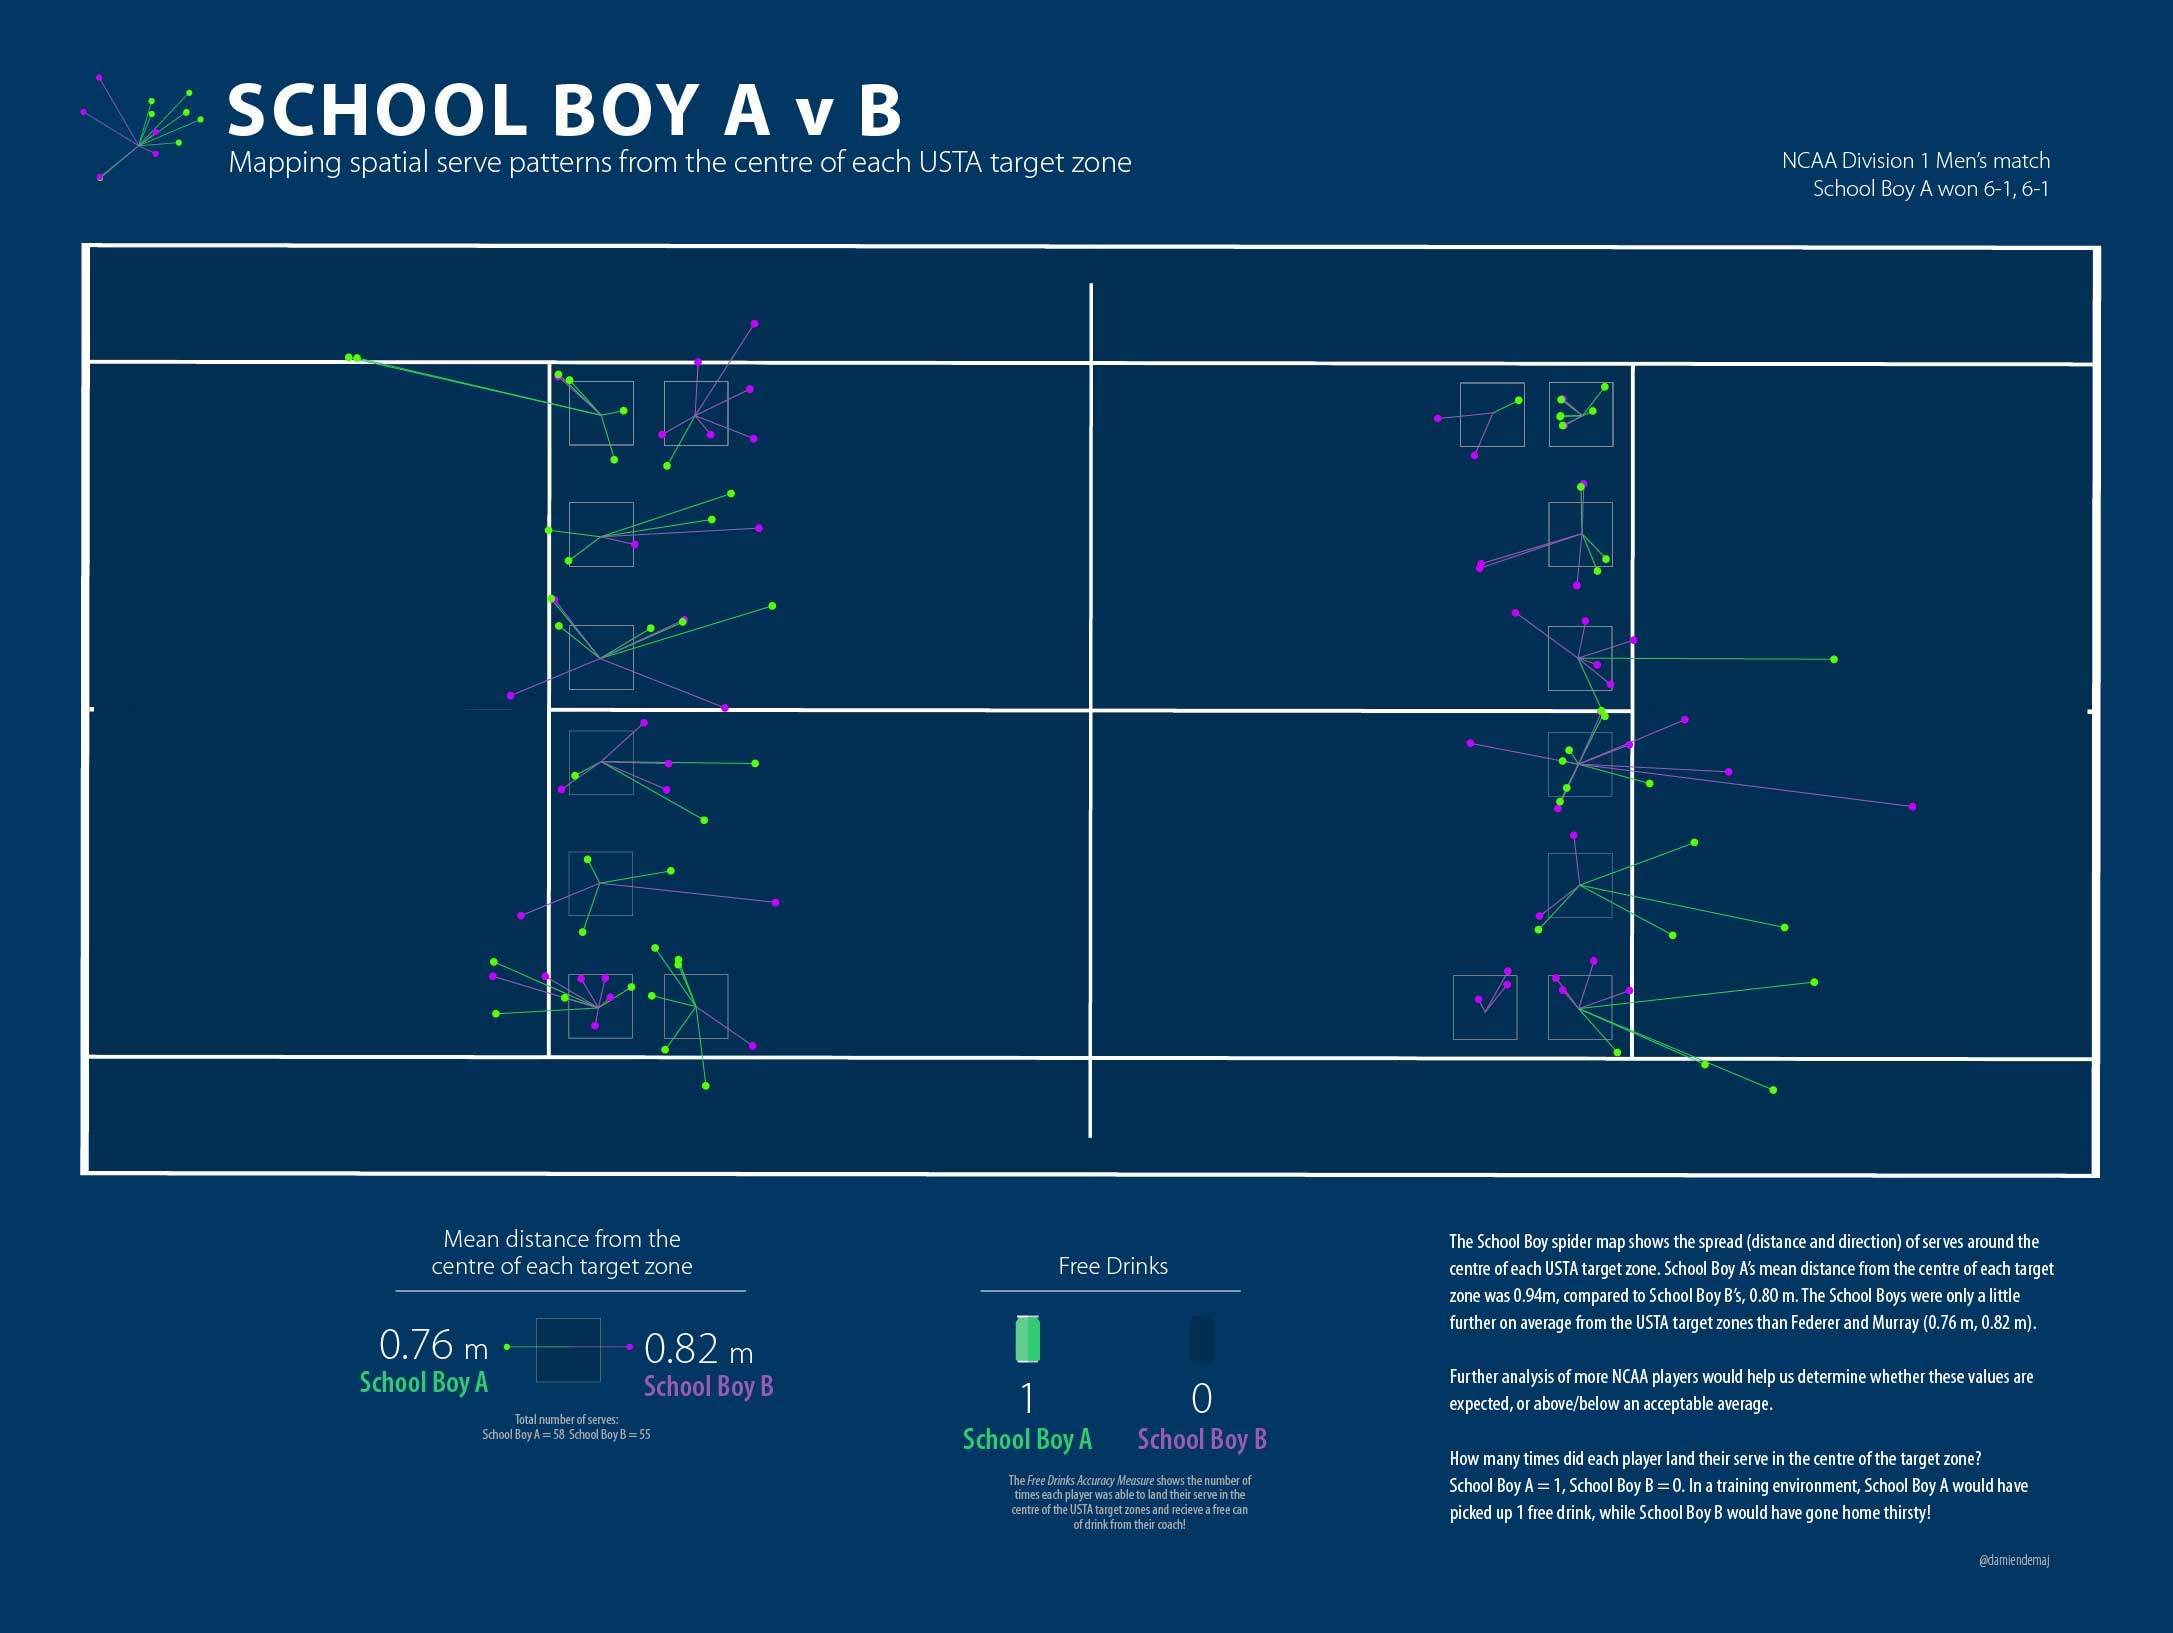
NCAA Tennis Serve Spider DiagramFigure 2. School Boy A v School Boy B. Mapping spatial serve patterns from the centre of each target zone. (click to enlarge)

The results show us that School Boy A picked up only 1 free drink, while School Boy B went thirsty not hitting the center of any of the targets! Ok, so now I’m feeling really good.

School Boy A on average missed the centre of the target zone by 0.94 m, while School Boy B was only out by an average of 0.80 m.

As discussed in part 2 of the blog, it’s reasonable to assume that perhaps the players weren’t targeting the centre of each zone. What if they were aiming for a ‘optimum’ but higher risk serve position? In part 2 of the blog we argued that the corners and lines were the ‘optimum’ positions to land your serve. So let’s see how far each player was from these ‘optimum’ serve positions.

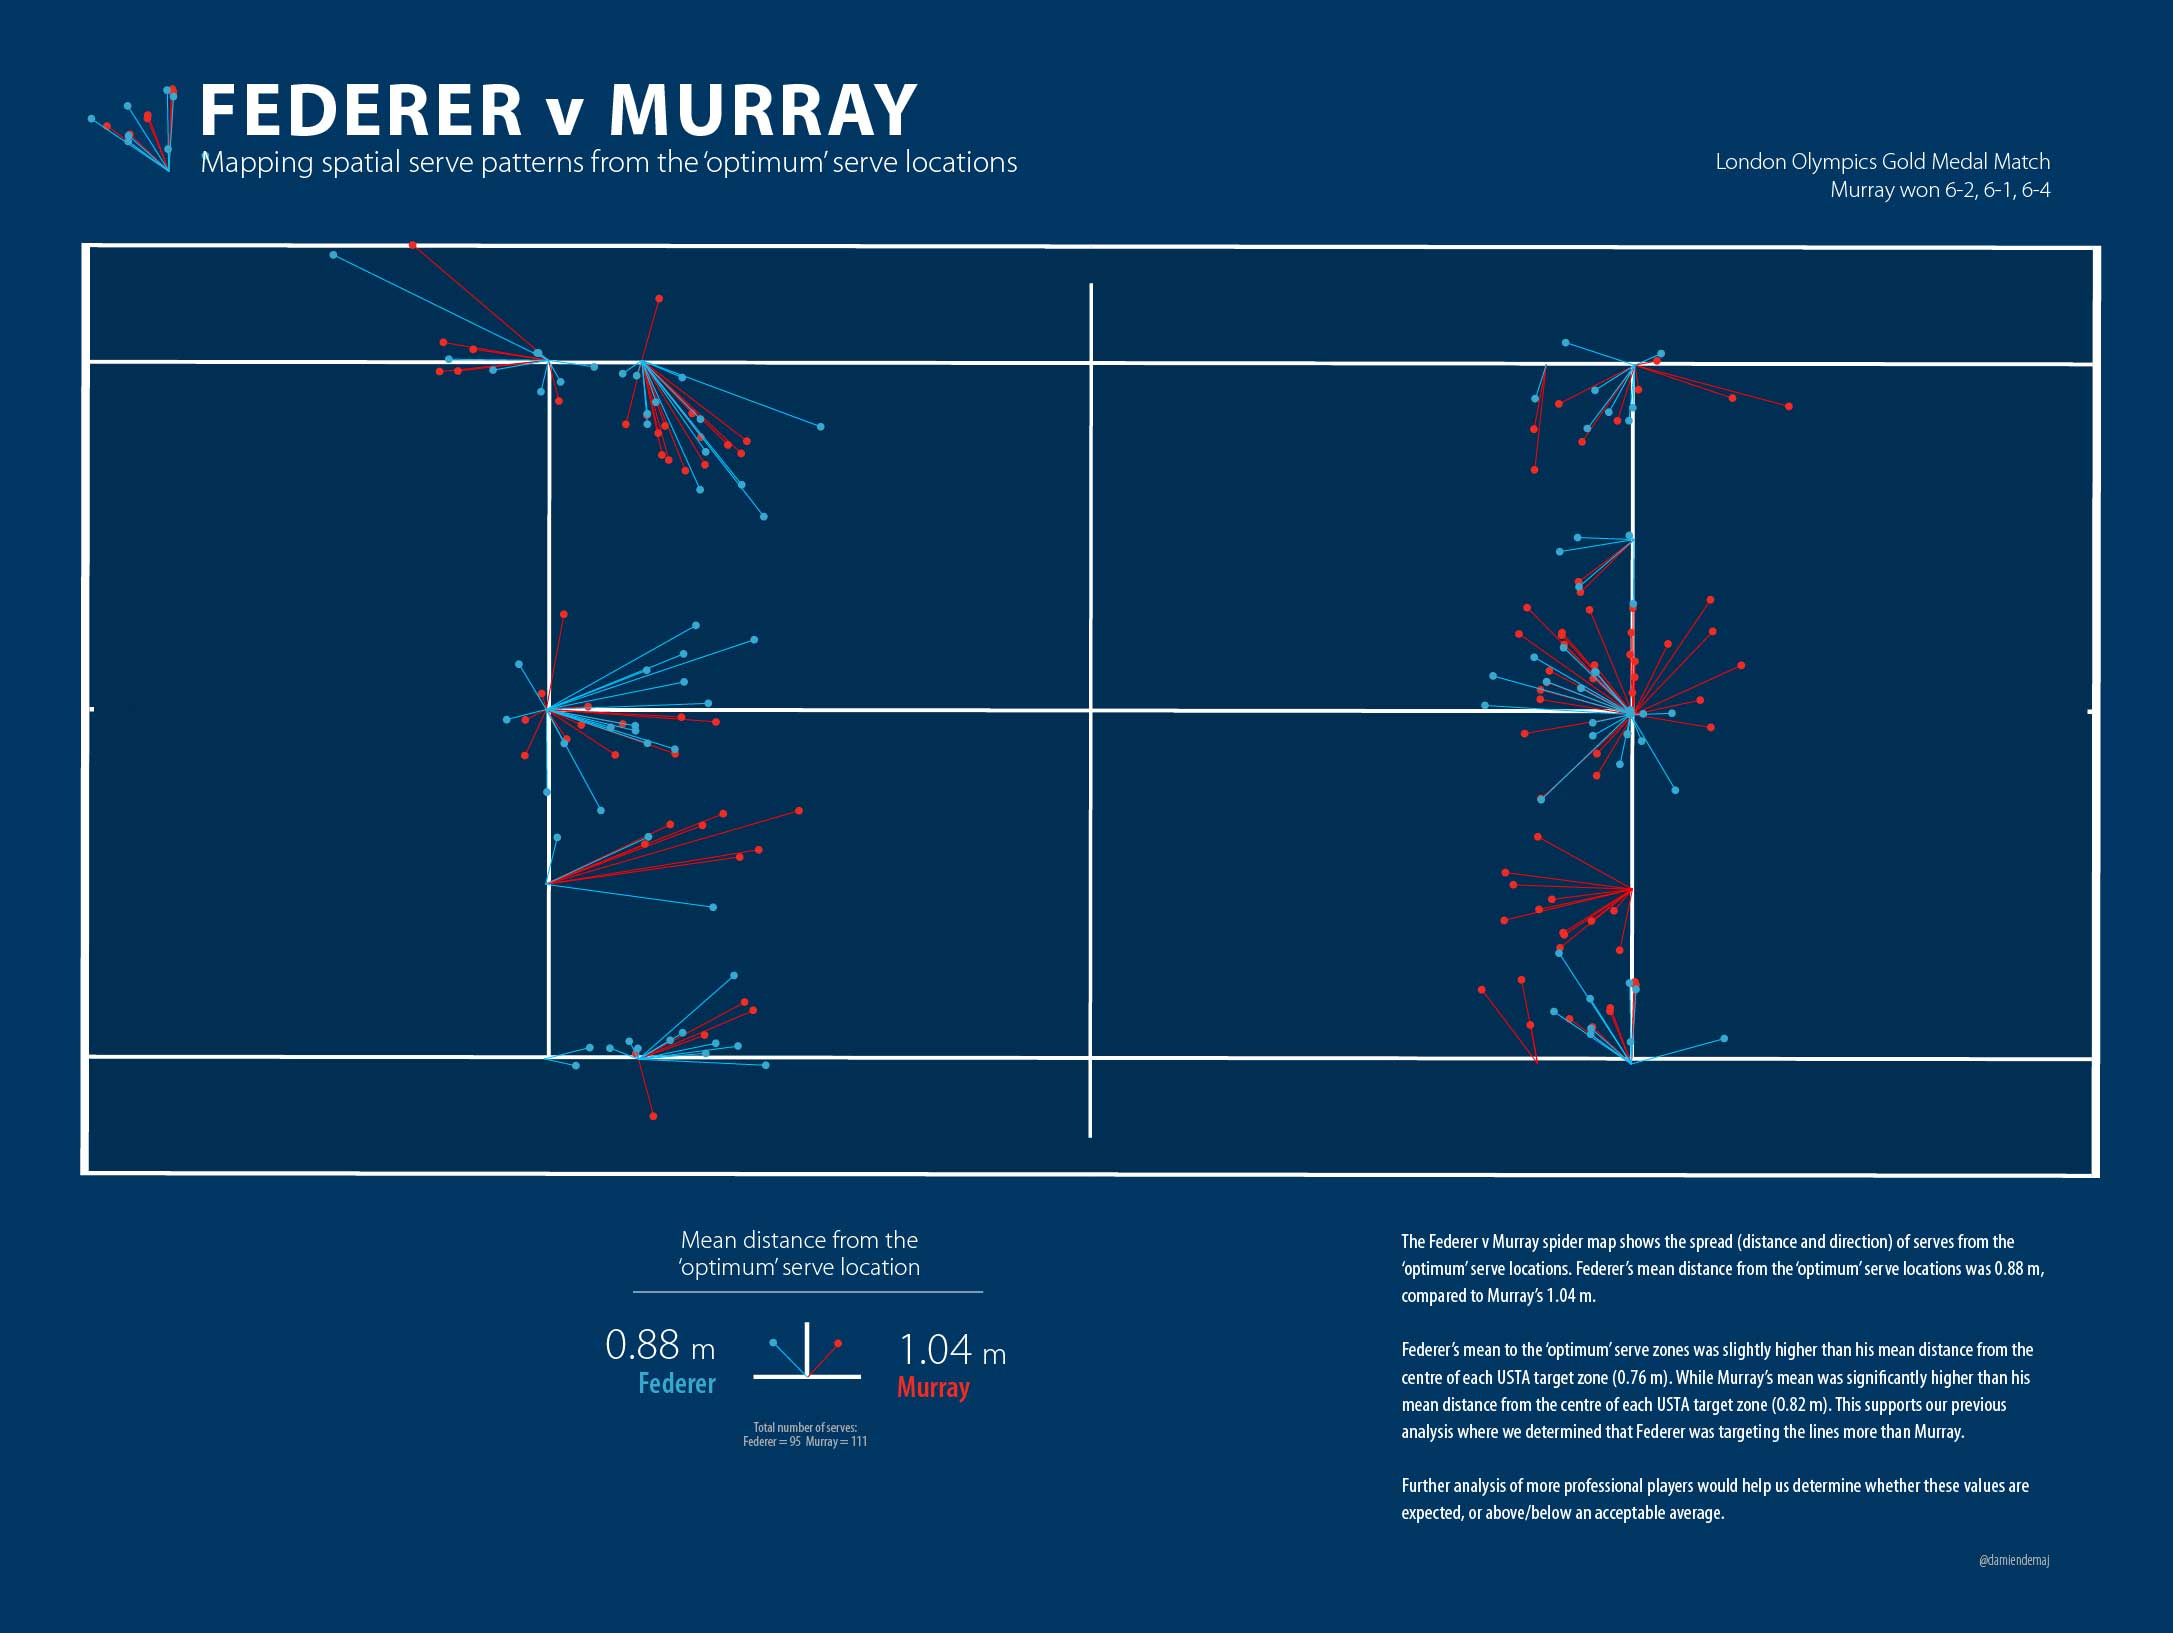
Federer Murray Serve Map Spider Diagram 2Figure 3. Federer v Murray. Mapping spatial serve patterns from the ‘optimum’ serve locations. (click to enlarge)

Figure 3 shows us that Federer missed the ‘optimum’ serve locations on average by     0.88 m, while Murray missed on average by 1.04 m.

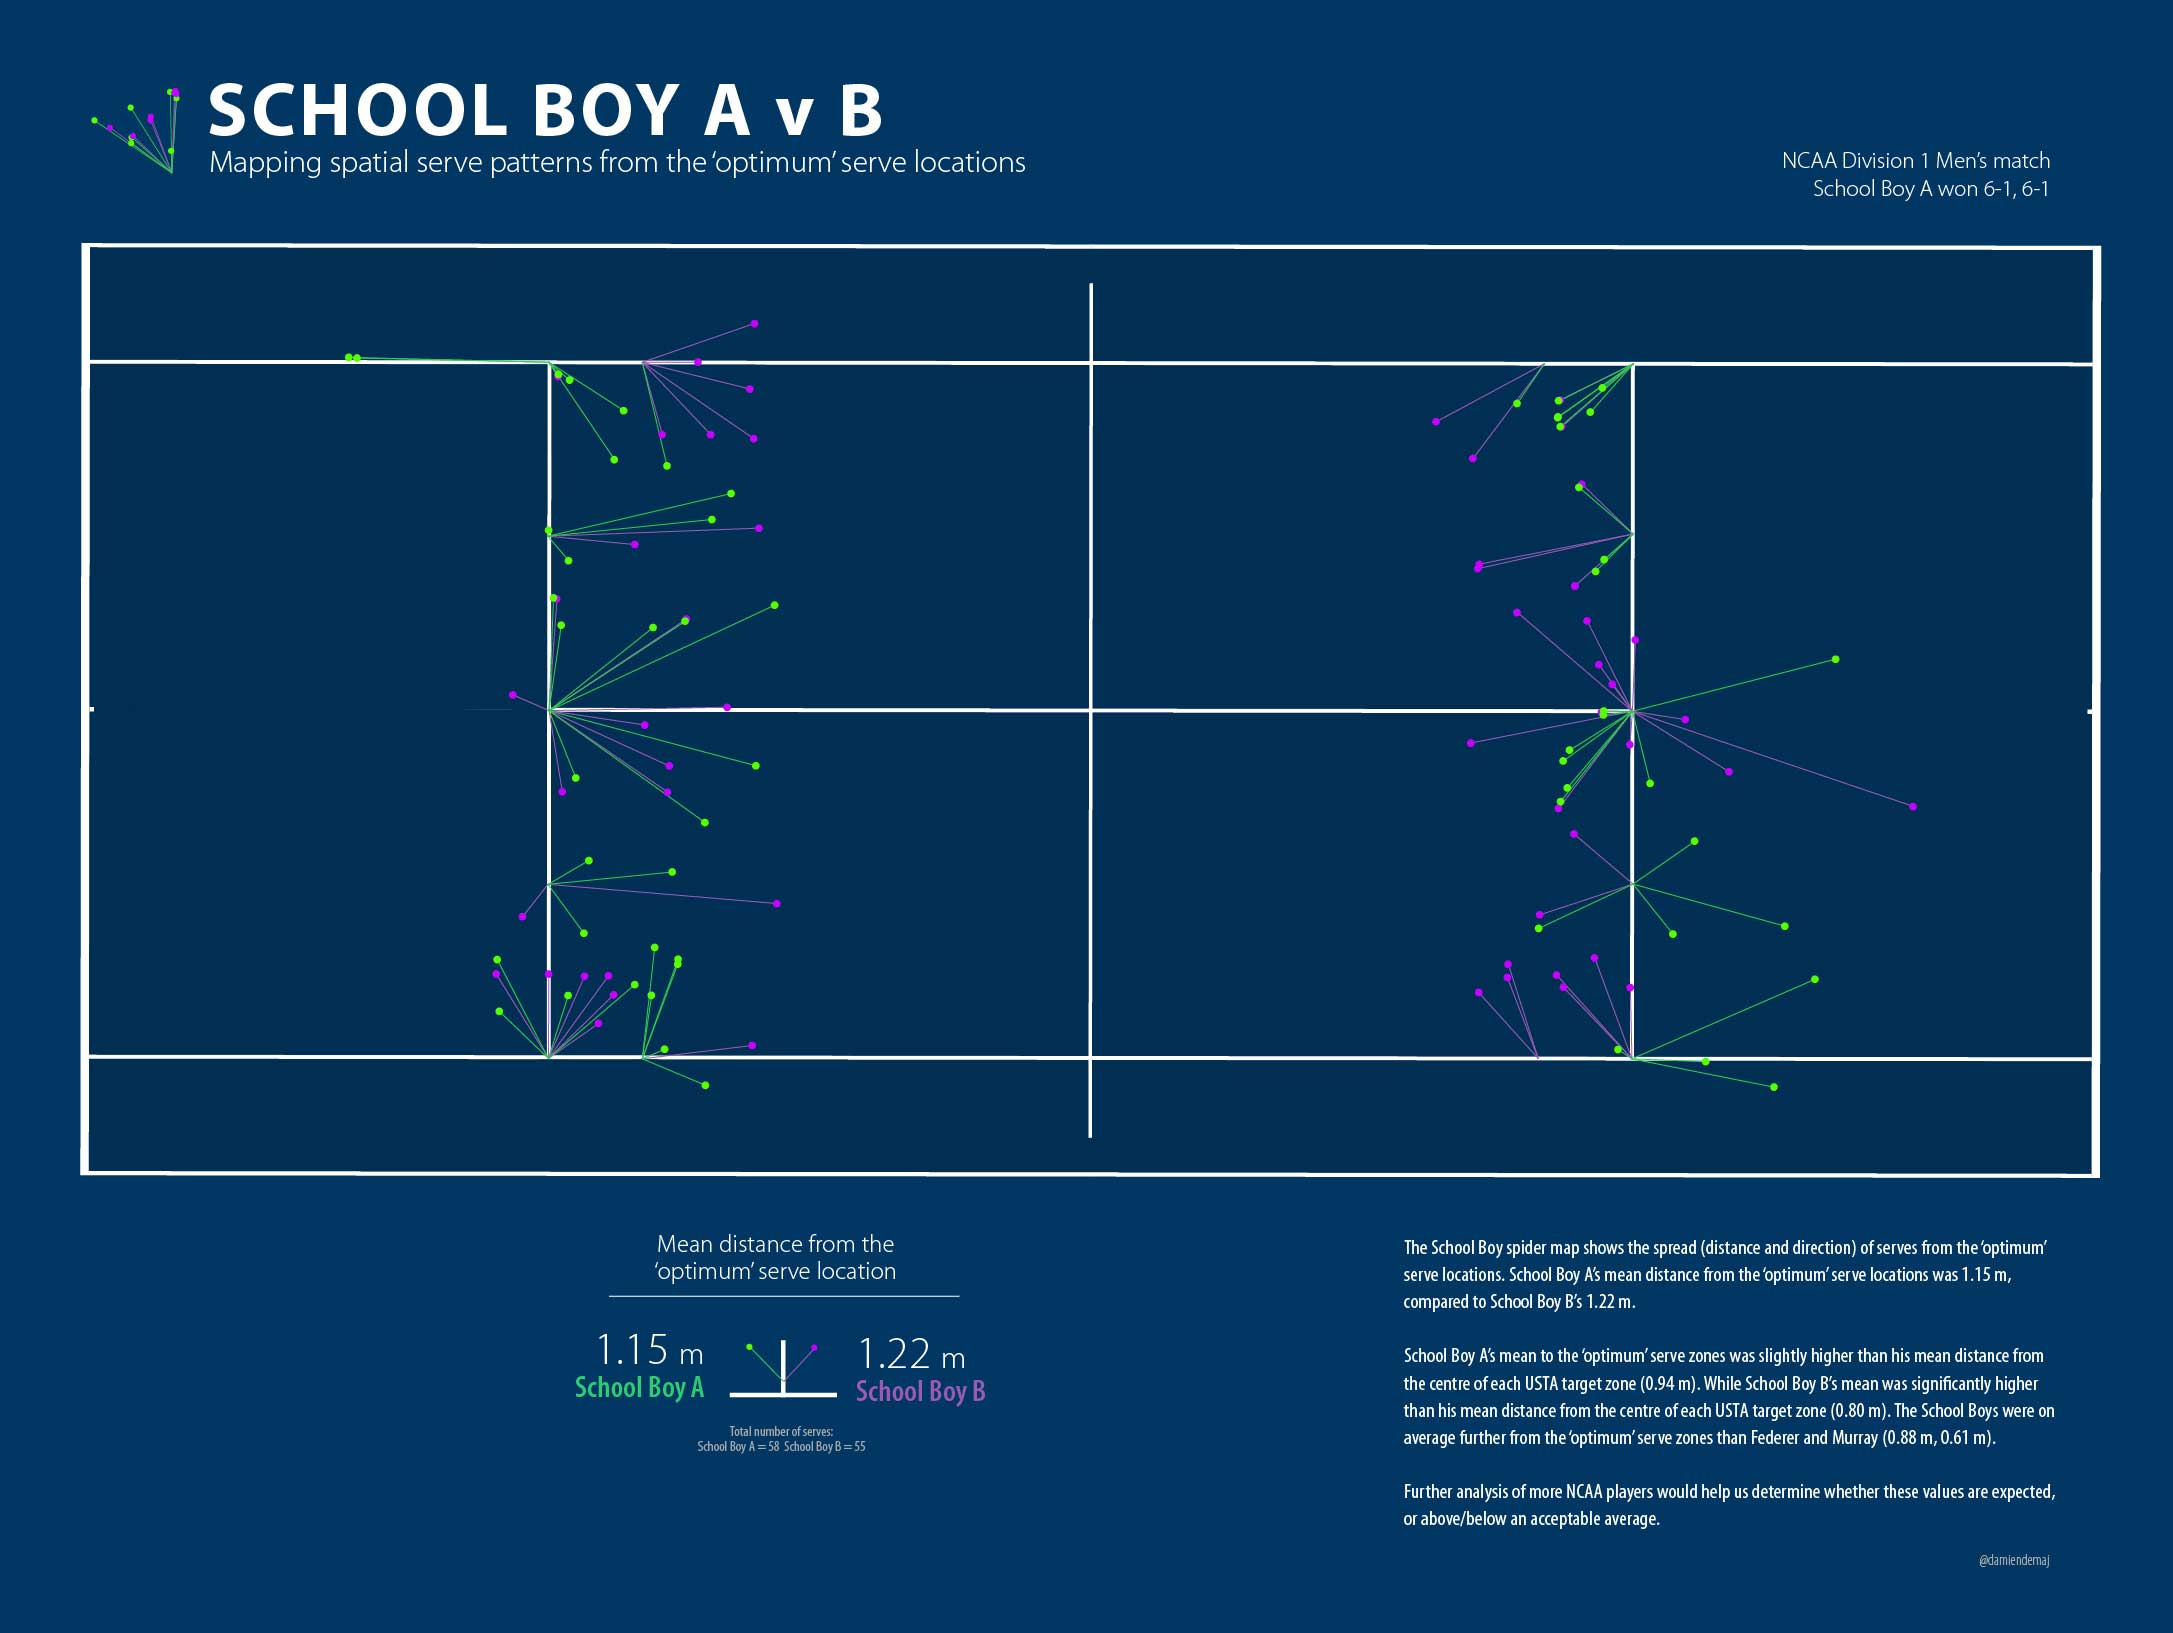
NCAA Serve map Spider DiagramFigure 4. School Boy A v School Boy B. Mapping spatial serve patterns from the ‘optimum’ serve locations. (click to enlarge)

Figure 4 shows us that School Boy A missed the ‘optimum’ serve locations on average by 1.15 m, while School Boy B missed on average by 1.22 m.

What can we learn from this?

Well we know that Federer takes home as many free drinks as the other three put together! We also know that Federer was on average serving closer to the ‘optimum’ locations than Murray which supports our analysis in part 2 of the blog, where we found Federer to target the high risk zones more than any other player.

We all expected the spread of the School Boy serves around the ‘optimum’ zones to be greater than the Big Boys due the results in part 2, where the Big Boys landed more balls in these ‘optimum’ areas. When we changed the target position back to the centre of each zone the School Boys and Big Boys numbers pretty much evened up, again supporting the results in part 2.

Spider Diagrams: The spider diagrams allowed us to visually link the serves to their target points and see the spread (length and direction) around each point. The spider lines for each zone allow us to very quickly see any bias in direction and distance towards the spread of serve around the points.  Without the lines it would be difficult to identify the serve clusters, and which central point they belong to.

Outliers: There were a couple of serve outliers for the Big Boys but these didn’t affect their averages enough to remove them from the calculations. The School Boys certainly had some big misses, but because there were multiple instances of these so they were left in the calculations.

More Data: With a larger dataset across different players we would be able to determine what is the expected norm, and whether these results are above or below that. Unfortunately, large serve datasets that are easily accessible to the players, coaches or analyst do not exist in tennis (hint hint ATP and WTA).

0.75 m: Let’s think back to part 2 of the blog for a minute. The size of the USTA target zones are 0.75 m square. Perhaps this tells us something. On average the four players missed by 0.83 m. Maybe the USTA set their targets knowing these missed averages and that is the reason for the particular size of the boxes?

To Summarize…

Over the course of the three blogs I have presented an alternative way of assessing a player’s serve accuracy using the USTA defined serve zones, and an additional two ‘higher risk’ zones. When comparing serve accuracy around the USTA zones there was very little difference between the four players. However once we started to analyze the serve towards the higher risk zones (the ‘optimum’ serve areas) the results started to lean in favor of the Big Boys, Federer and Murray.

I also set out to determine whether serve location really matters in tennis. The results suggest that it depends on what level of tennis is being played. The Big Boys clearly had more outright success on serves that landed in the USTA zones, and the higher risk zones than if they missed these zones. It was a different story for the School Boys however, as it didn’t appear to make any difference to their outright success rate whether they served in or outside the zones.

There is much work to be done in expanding the analysis of serve accuracy, serve success, and general serve patterns. Let’s hope we start to see more meaningful statistics from broadcasters and commentators about the serve in order to better understand who really are the best servers in the game!

Pinpointing the serve. Who’s better? The Big Boys or the School Boys?

(Part 2 of 3)

In part 1 of this 3 part series, I set out to find which player out of Federer, Murray and two NCAA Division 1 players were able to land the highest proportion of their serves in the USTA target zones.

Surprisingly the School Boys outranked the big boys in this simple comparison. However once we moved the target to include zones closer to the lines, Federer’s serving clearly stood out as being the most accurate. See part 1 for the complete results of the analysis. In order to gain some real value out of this analysis, I set out to determine if there was a positive relationship between serve position and outright serve success.

To explore this relationship I classified each serve into an ‘outright success’ category. Throughout the blog I will refer to an outright success point as a free point (to keep things simple).

Free Point definition: An error made by the player returning serve OR an ace made by the server. The remaining serves were either classified as being “returned in play” or “out” (fault).

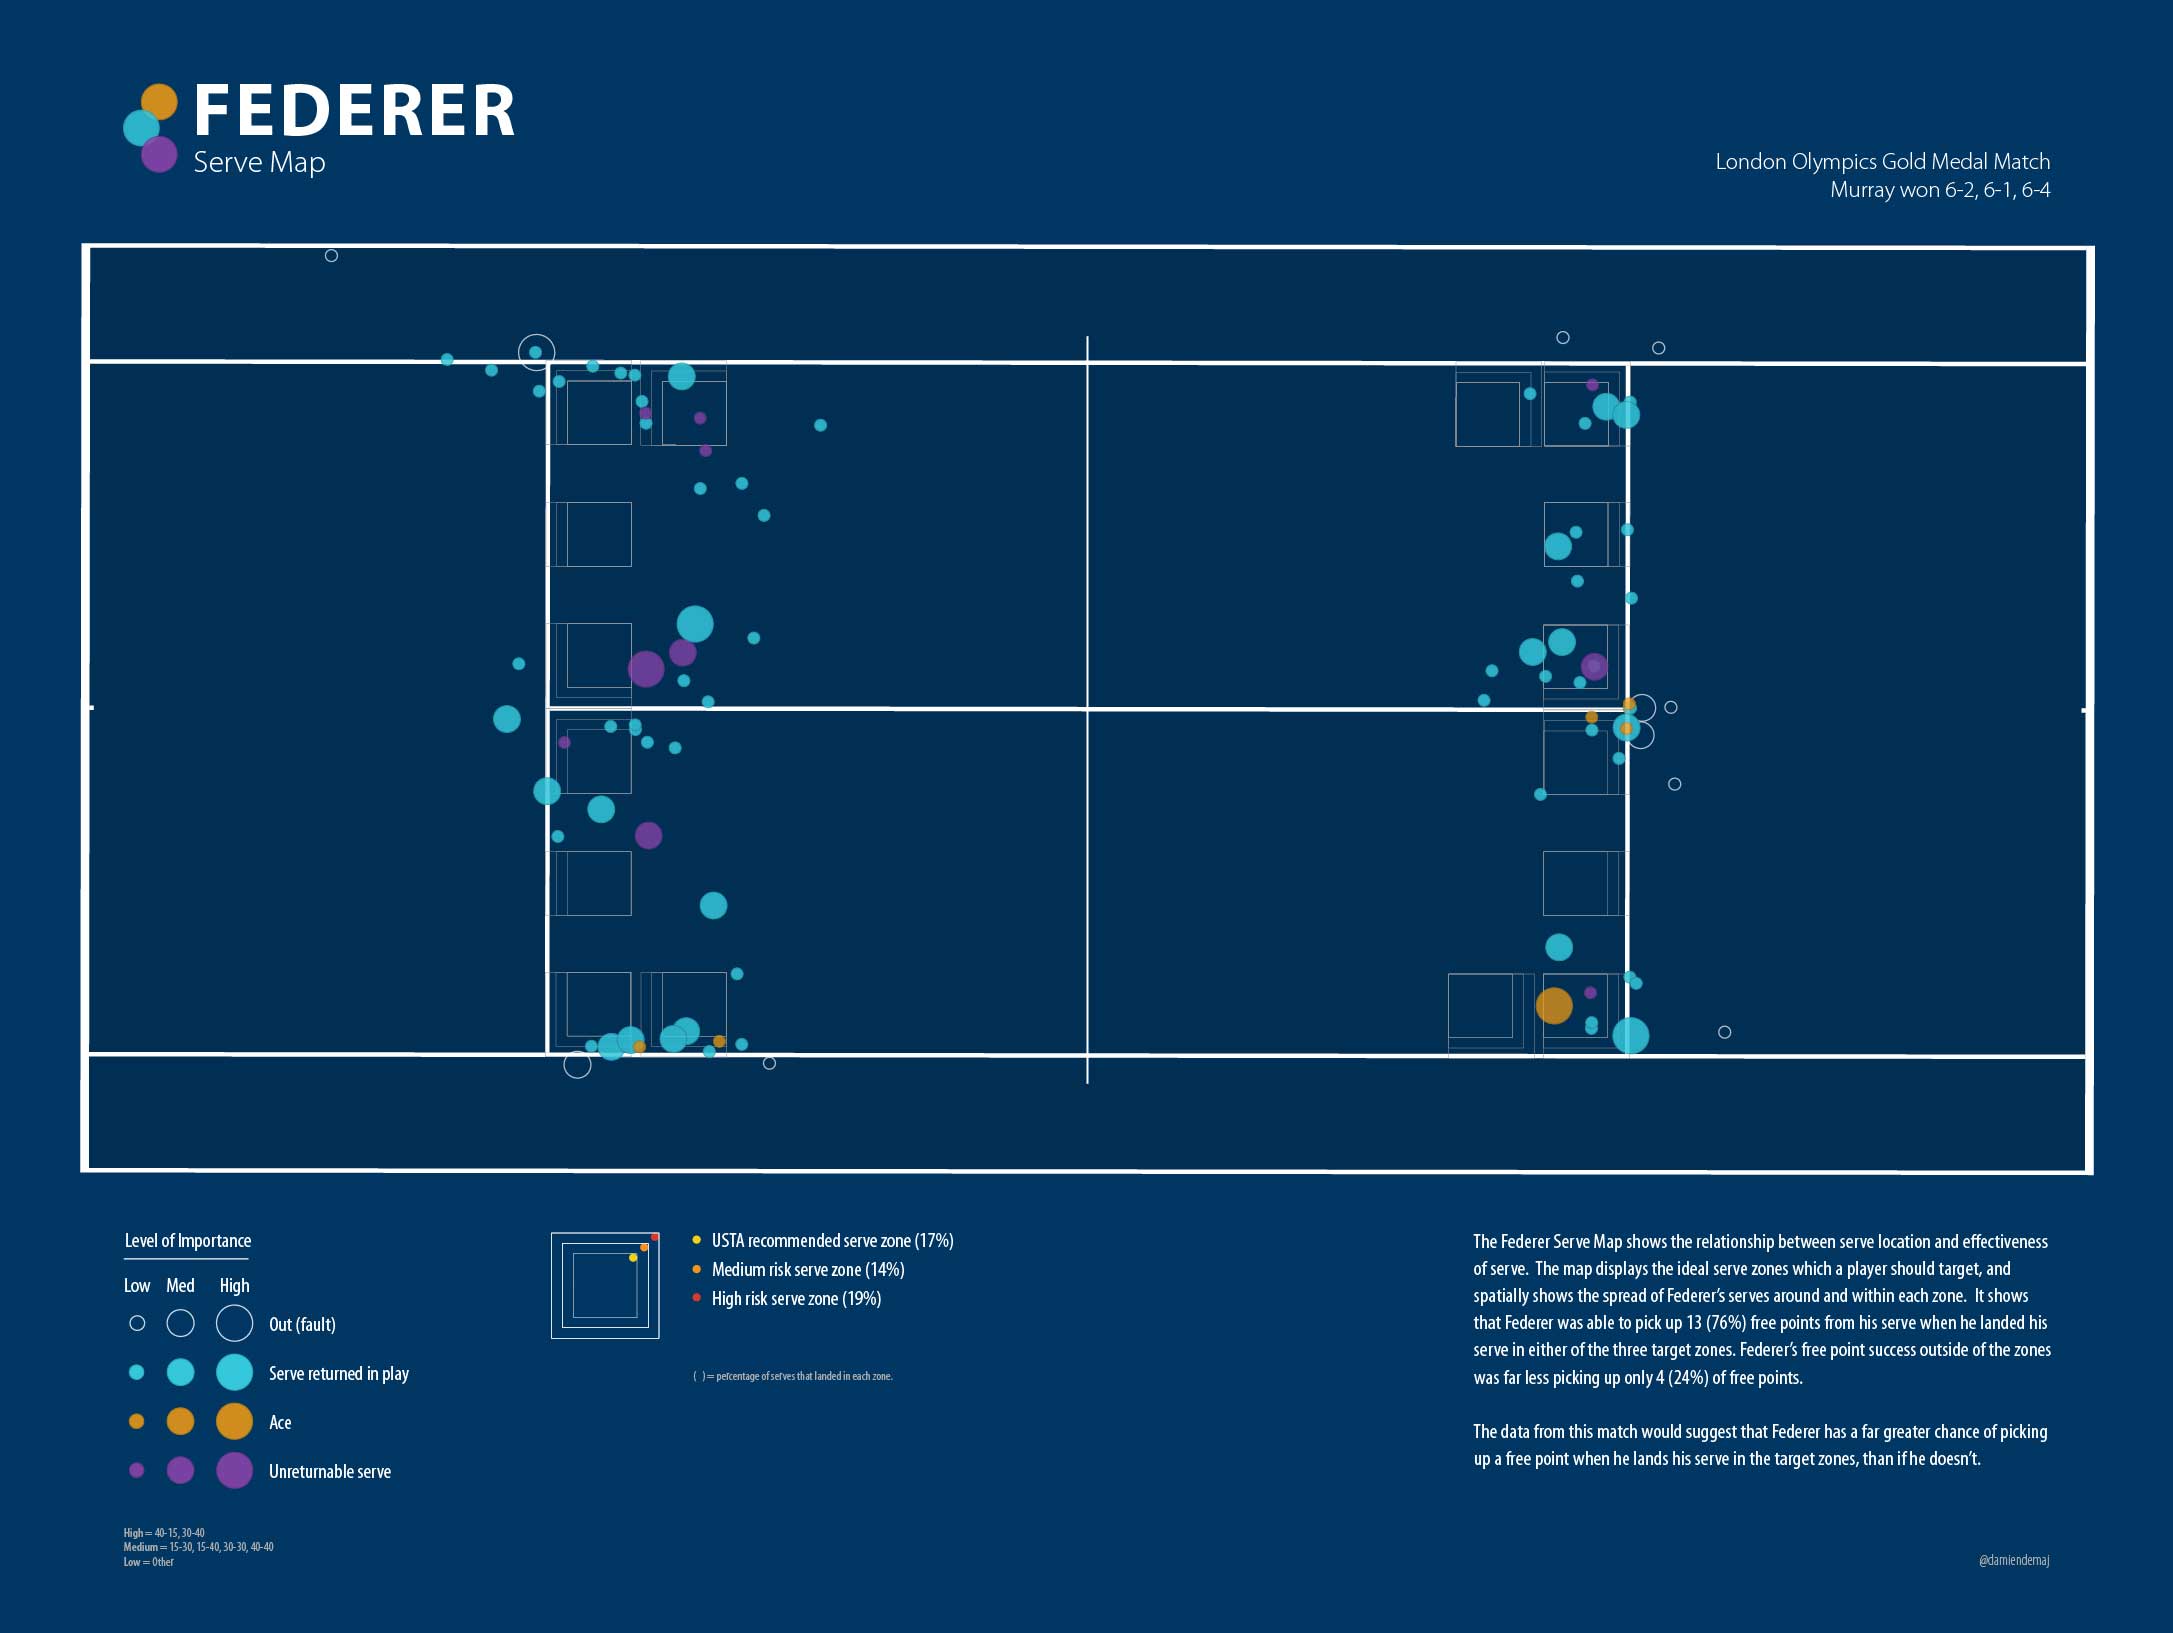
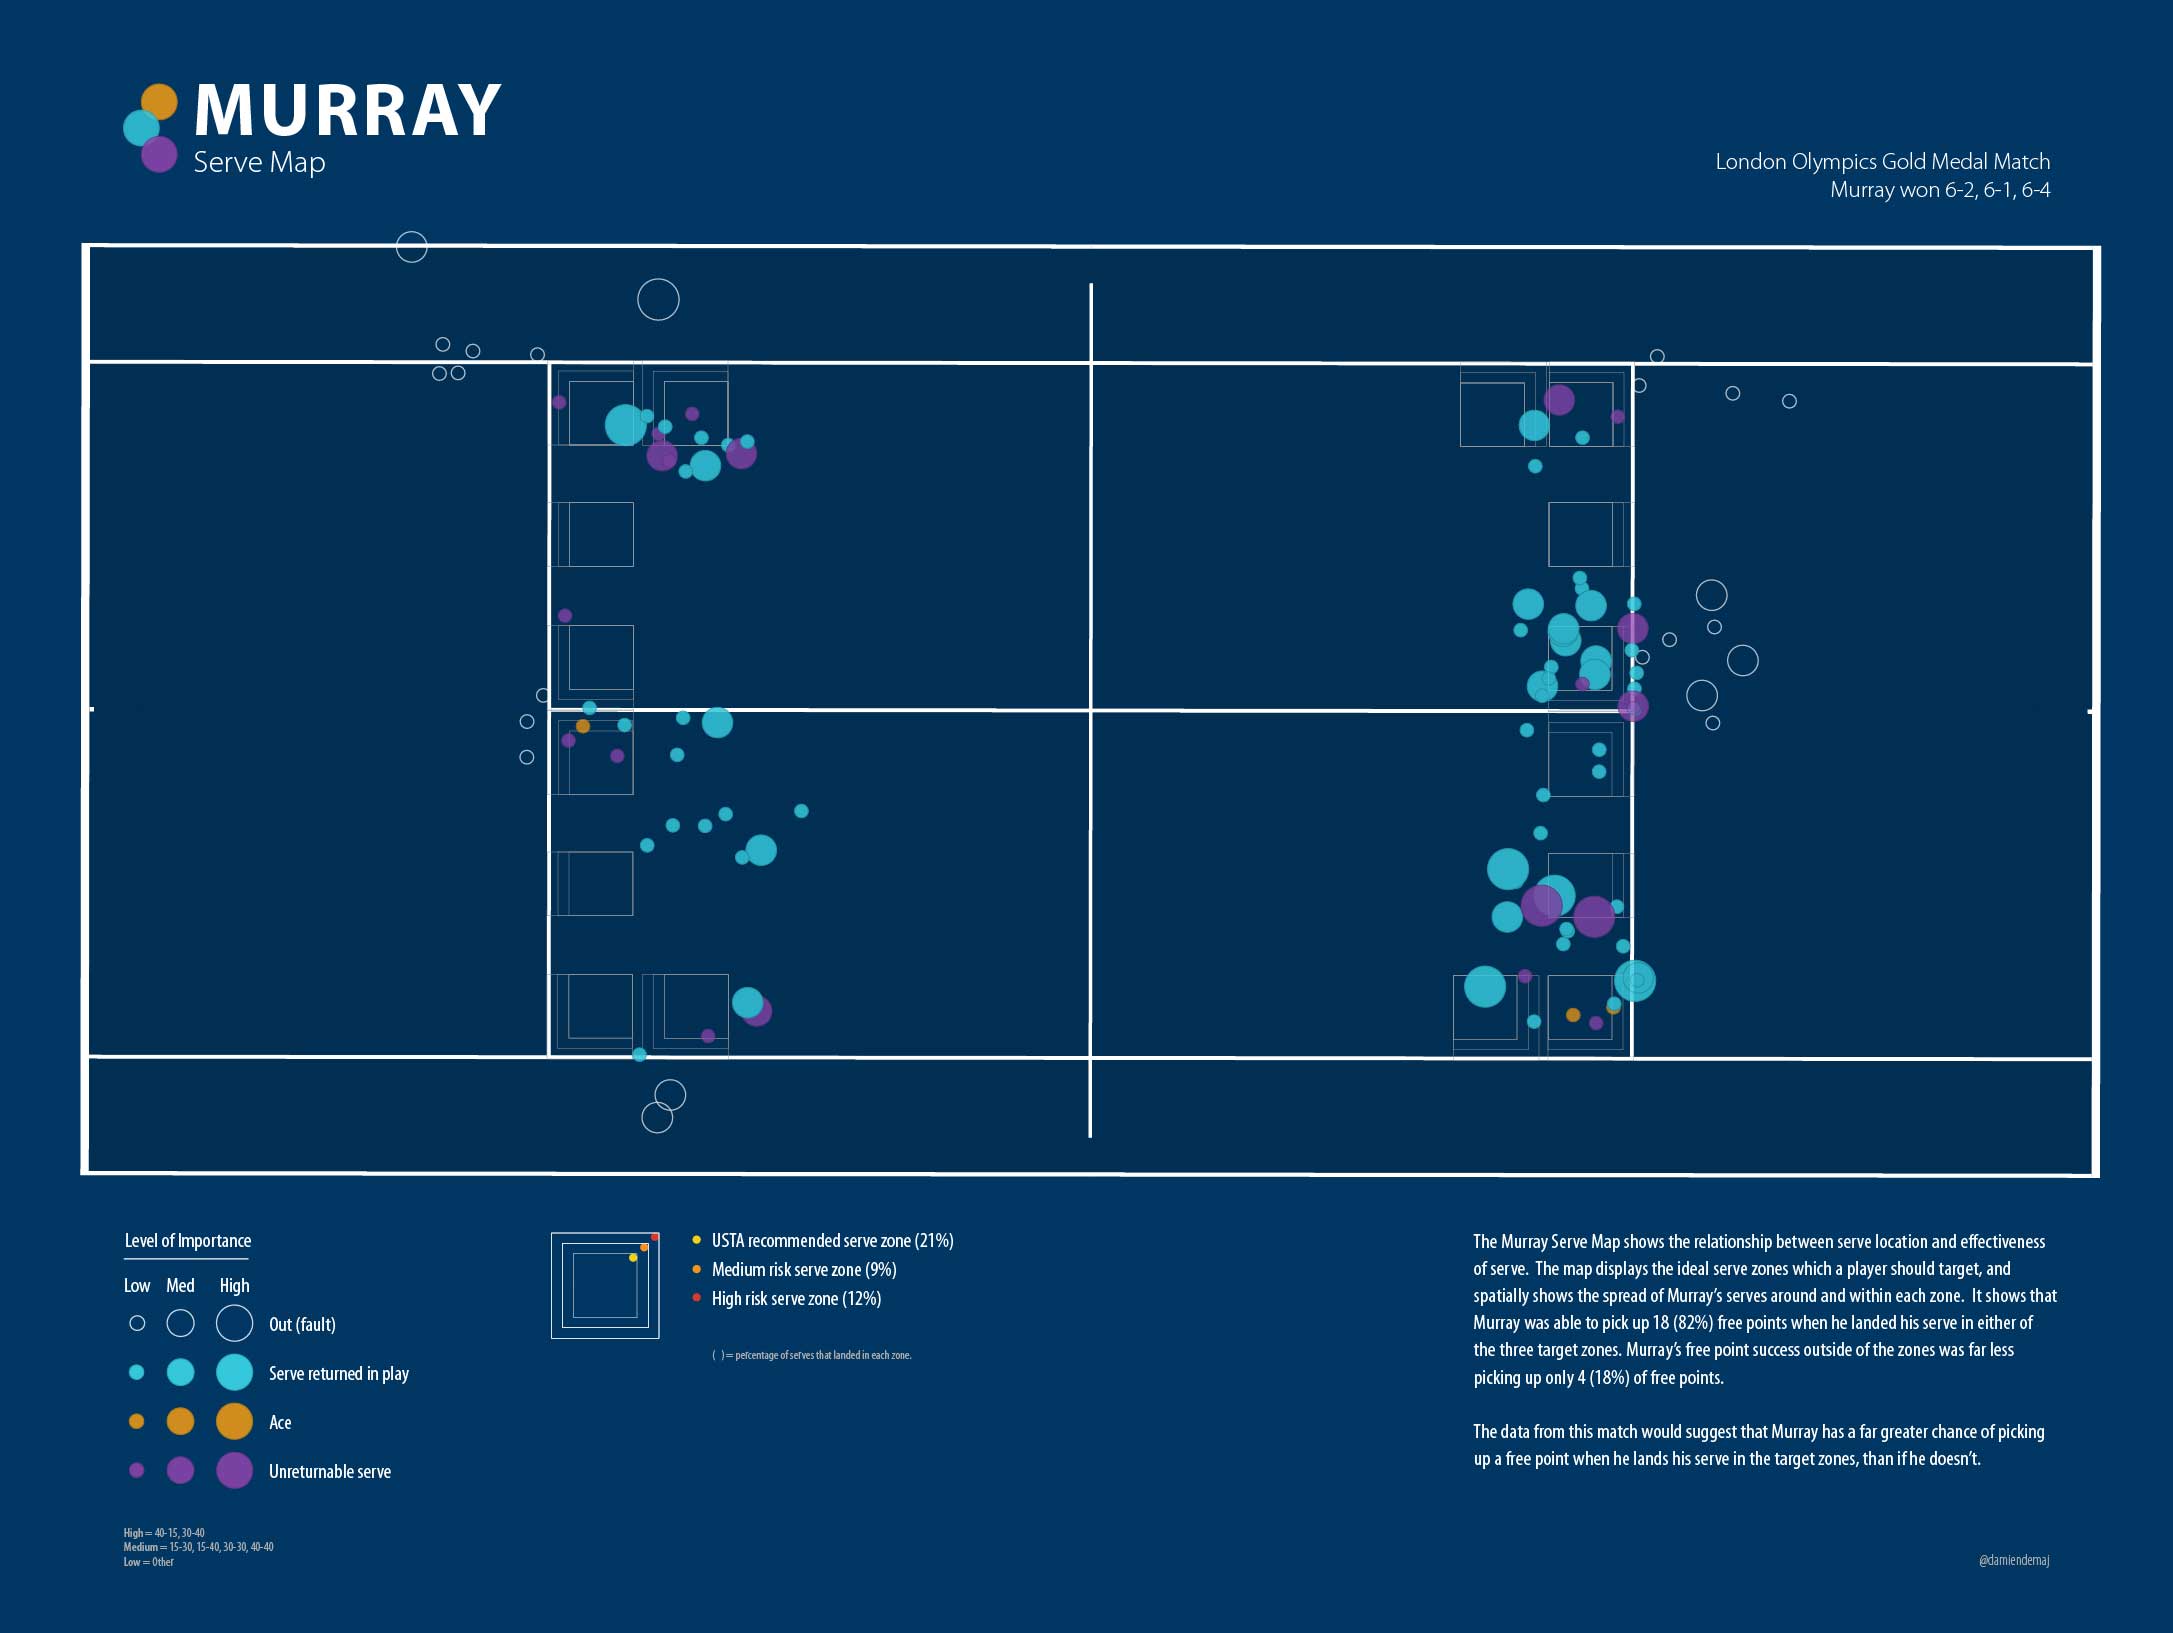
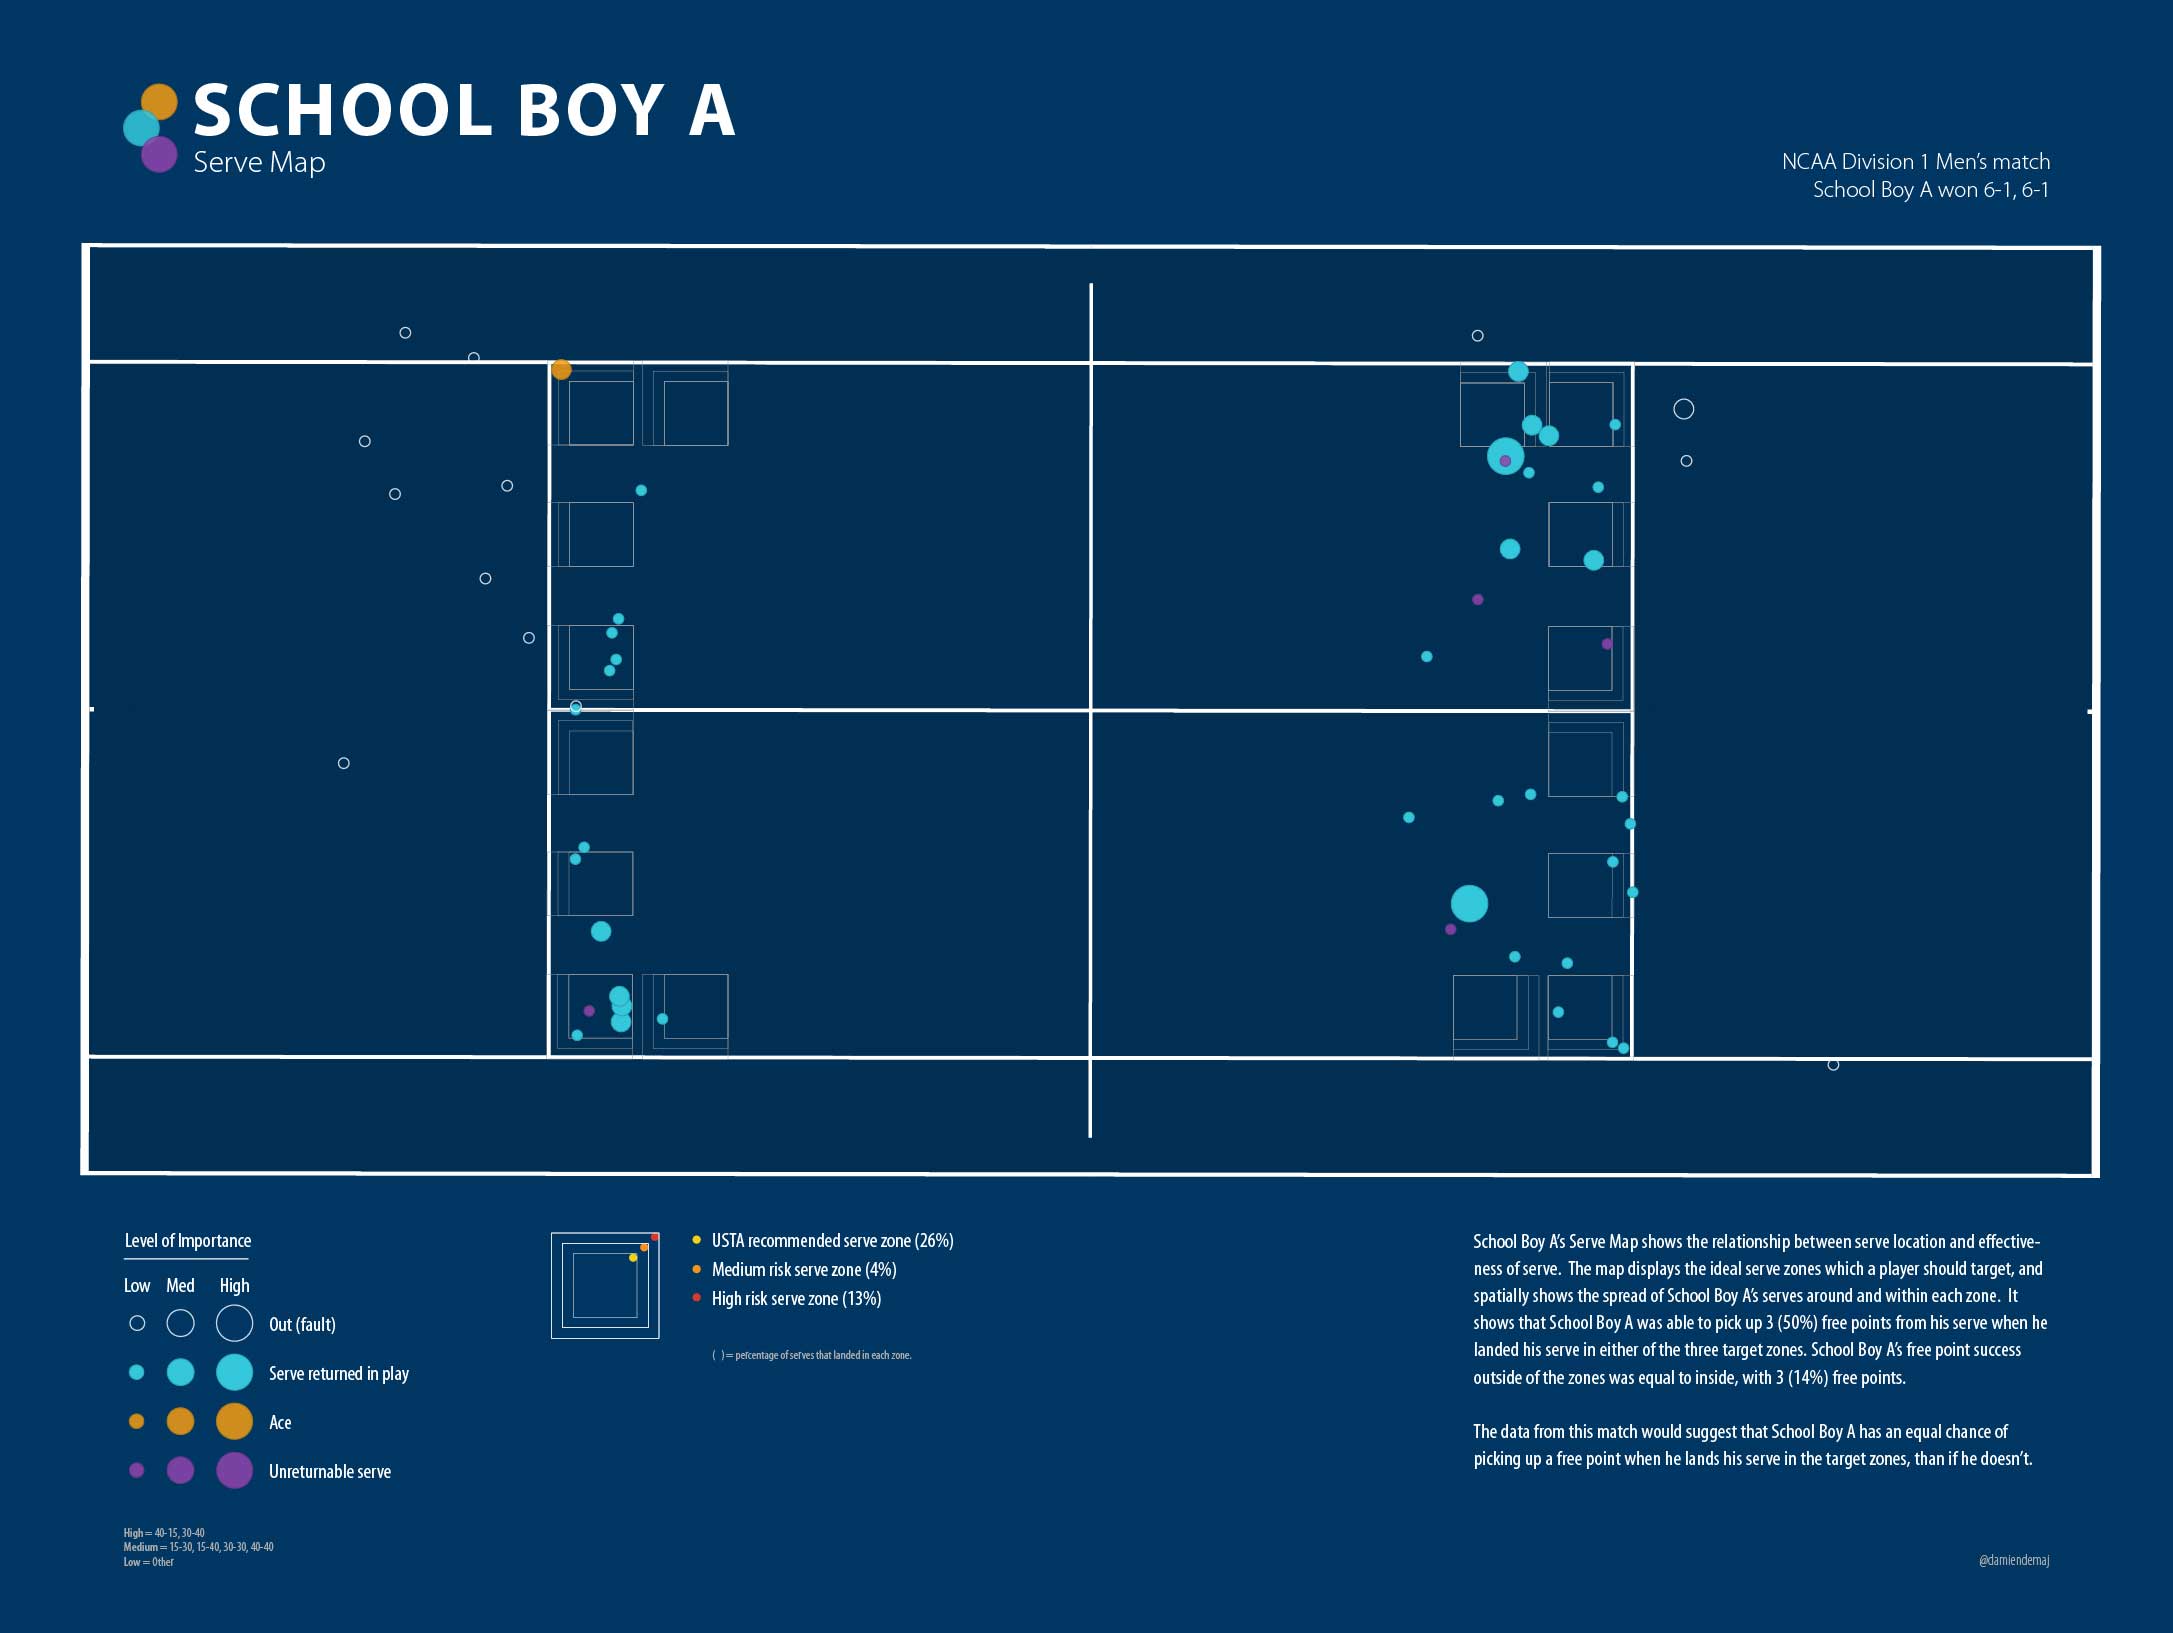
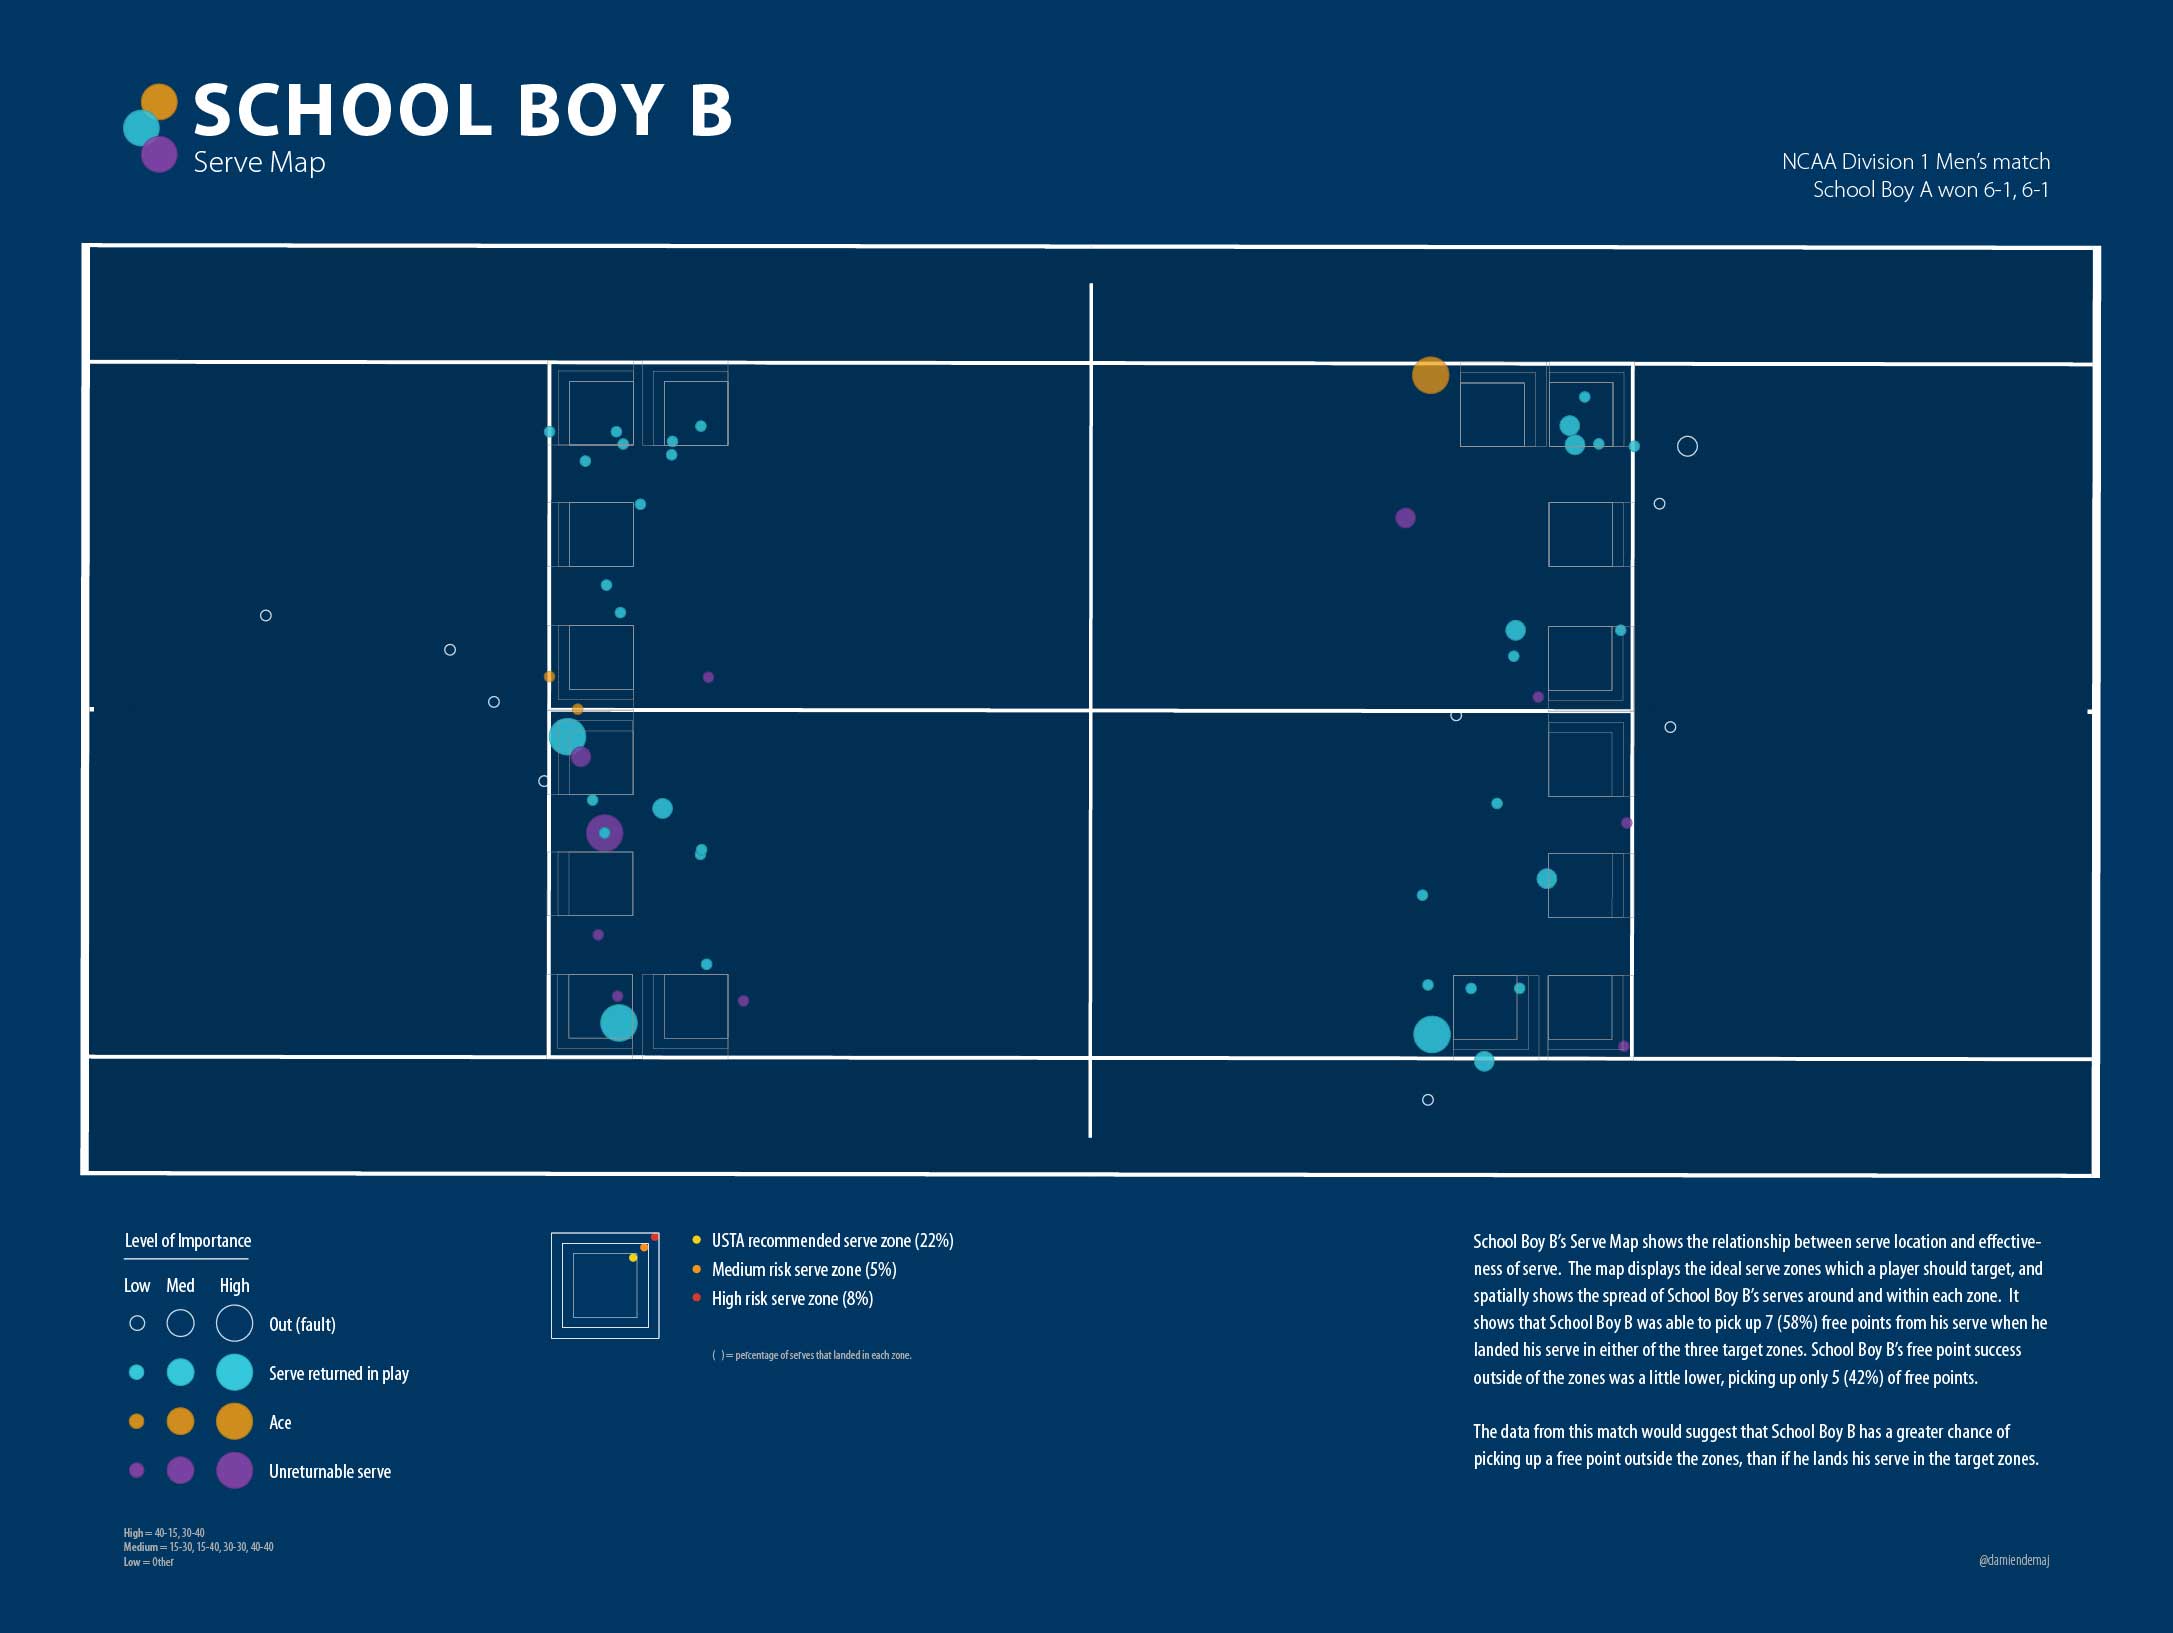
For each player I generated a Serve Map (see Figures 4 A-D) showing the position of their serves in relation to the three target zones and their free point success.

Click to enlarge each map.

Federer ServeFigure A. Federer’s Serve Map

Murray ServeFigure B. Murray’s Serve Map

NCAA Tennis PlayerAFigure C. School Boy A Serve Map

NCAA Tennis PlayerBFigure D. School Boy B Serve Map.

Mapping the relationship between serve location and the effectiveness of serve. The Serve Maps also show where each player served when it mattered most.

School Boy A was able to collect 3 (50%) free points from his serves inside the zones, compared to 5 (42%) for School Boy B.

Federer picked up 13 (76%) free points from his serves inside the zones, compared to 18 (82%) for Murray.

Summary: The Big Boys picked up 31 (79%) free points from serves that landed in the target zones, compared to 8 (44%) for the School Boys.

Across all four players, 39 (68%) serves out of 57 that landed in the target zones earned the players a free point.

Serves that missed the zones: To test the importance of serve position I calculated how many free points each player picked up off of their serve that landed outside the target zones, but still within the service box.

Federer picked up only 4 (24%) free points on serves outside the zones compared to 13 (76%) inside the zones. While Murray picked up 4 (18%) outside the zones, compared to 18 (82%) inside the zones.

School Boy A picked up 3 (50%) free points when serving outside the target zones, which equalled his inside count 3 (50%), while School Boy B picked up 7 (58%) free points outside, which was more than his inside count of 5 (42%).

Summary:  The Big Boys picked up only 8 (21%) free points from serves that landed outside the target zones, compared to a surprisingly high 10 (56%) for the School Boys.

Across all four players, 18 (31%) serves out of 57 that landed outside the target zones earned the players a free point.

Take-aways:

Based on the data in this analysis the Big Boys clearly had more success on their serve when they landed their serve into the target zones (79% to 21%). This is a significant difference. At this level the Big Boys almost quadruple their chances of getting a free point off of their serve if they land it in the target zones!

Interestingly, the same trend didn’t occur for the School Boys. Player B recorded more success outside the zones than inside (58% to 42%), while School Boy A had the same level of success inside to out. So does it mean at the lower levels of the game that serve position is not all that important? Well it is quite possible. However we need to be a little careful about the above statement given the small-ish sample size and the fact that the study only included two players. It would be interesting to see what the numbers would do over a larger sample size, and with more players. Likewise for the Big Boys, would the high level of success remain with a larger sample spread over different players?

Overall across the four players free points were easier to get inside the target zones than out.

The USTA suggest that improving and practicing your serve location will help strengthen your game, and with some luck you might just pick up some free points along the way! Well that may well be the case, but it also might depend on which level of the game you’re playing!

In part 3…

In the final part of this three-part blog we are going to have some fun and address the most important question of all. Which player picked up the most free drinks by landing their ball in the center of the target zones? I present another series of maps showing spider diagrams to visualize how far each player was from the centre of each zone!

Pinpointing the serve. Who’s better? The Big Boys or the School Boys?

(Part 1 of 3)

We have all been there, standing on the baseline when the coach places three cones in each service box and says “There’s your target, if you hit the cones you’ll get a free can of drink”.  If you were like me, you rarely hit the cone, and if you did, it was more luck than anything else!

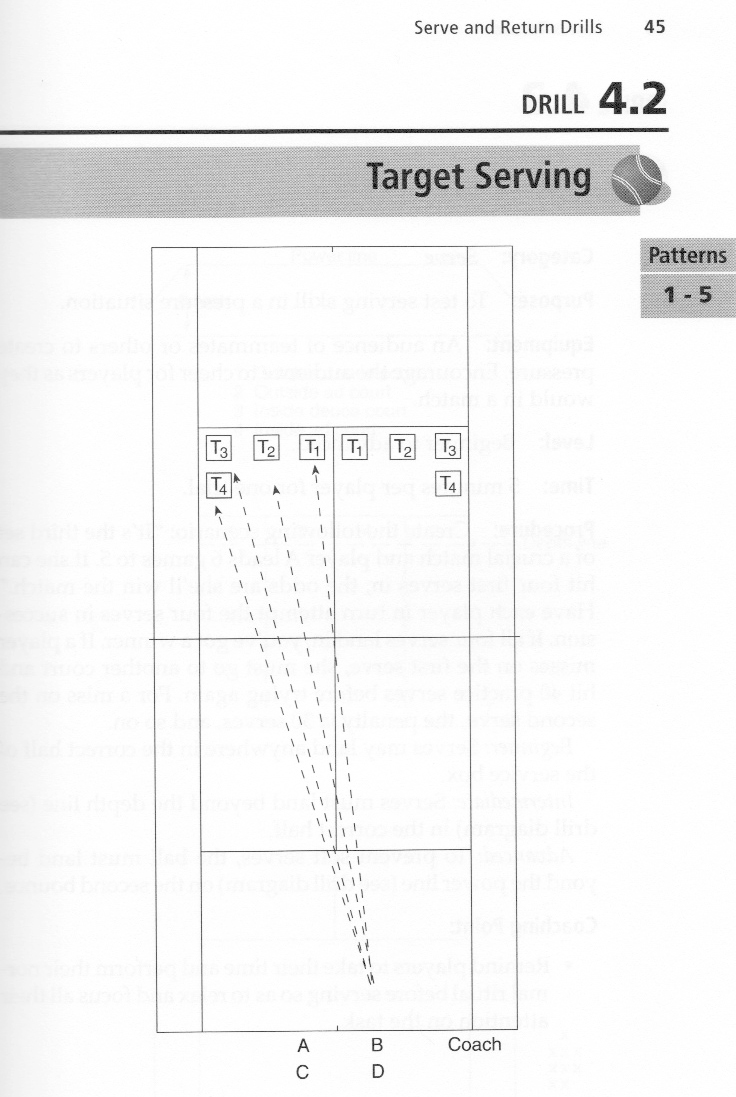
Coaches have been using these types of serving drills for many years. Why? Well, in order to develop a successful serve, you need to practice the placement of your serve. In the USTA book titled Tennis Tactics, Winning Patterns of Play, drill 4.2 (p 45) outlines four target zones in each service court to aim for (see Figure 1).  It is in these zones where coaches place their cones to improve the serve placement of their players (and give away free drinks!).
USTA Target Serve Zones

Figure 1. The four recommended serve target zones in each service court as recommended by the USTA. Down the T (T1), a body serve (T2), a wide serve (T3) and short-ish out-wide serve (T4). Source: Tennis Tactics, Winning Patterns of Play, USTA.

Given the continuous emphasis on serve placement I set out to run a simple analysis to see who was the more ‘accurate’ server, the Big Boys (professional players) or the School Boys (college level players)? Included in this analysis are Roger Federer and Andy Murray representing the Big Boys, and the School Boys (whom shall remain nameless) are from the NCAA Division 1 tennis competition.

Some Context:

  • Murray defeated Federer: 6-2, 6-1, 6-4
  • School Boy A defeated School Boy B: 6-1, 6-1

Total number of serves hit by each player:

School Boy A: 58   School Boy B: 54   Federer: 95   Murray: 111

Total number of serves hit IN:

School Boy A: 44 (76%)   School Boy B: 45 (83%)   Federer: 78 (82%)   Murray: 86 (77%)

Total number of serves hit OUT:

School Boy A: 14 (24%)   School Boy B: 9 (17%)   Federer: 17 (18%)   Murray: 25 (23%)

In order to determine which player landed the highest percentage of balls in the four USTA zones (and therefore could claim they were the most accurate server!) I ran a simple select by location algorithm between each serve bounce and the four target zones in each service court. This enabled me to very simply return a count of how many balls landed in each box, for each player. Figure 2 shows the results of the selection.

PinpointingYourServeFig1

Figure 2. The percentage of serves that landed in the USTA defined target zones for each player.

Surprised? Most of us would expect the Big Boys to place a higher percentage of their serves in the target zones than the School Boys right? However the results showed that School Boy A landed 15 out his 58 (26%) serves into the target zones, making him arguably the most ‘accurate’ server of the four players. School Boy B closely followed with 12 out 58 (22%). Murray was next up, landing 23 of 111 (21%) serves into the boxes, while Federer brought up the rear with only 16 out of his 95 (17%) serves landing in the boxes.

Accuracy: If we loosely define accuracy as being how close a measured value is to an actual value, where the actual value are the USTA target zones, then we can with some caution claim the School Boys out served the Big Boys in the accuracy department. Hard to believe I know.

But wait a minute, what if the Big Boys weren’t actually aiming for the USTA target zones, and instead were aiming outside of those zones? Perhaps they were aiming for the lines, which are outside the USTA defined target areas but still legally within the service court? What would the results look like if we extended the target zones further towards the lines? Let’s see…

Playing the Lines

You could argue that the service line is the optimum position for the placement of your serve, and that the corners of each service box are the ultimate targets. However targeting the lines brings a higher degree of risk, and a lower margin or error. Which is why coaches & the USTA don’t recommend us amateurs to go-for these targets every time! However at the top level where the Big Boys play, where there is so much on the line and so little margin for error (in all facets of the game) they are more likely to take the risk. By sending their serves as close to the lines as possible they give themselves a greater chance of setting up the point in their favor. We would also expect that they are more likely to consistently execute a higher level of accuracy, given their higher-level skill set. We shall see…

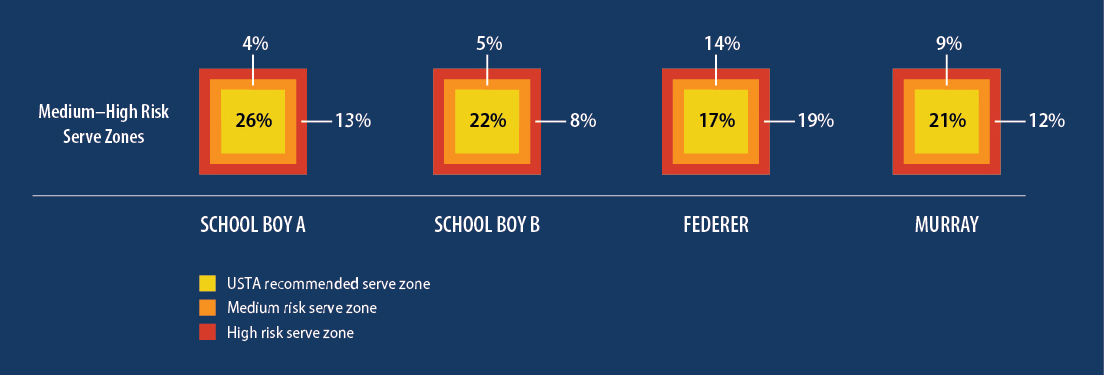
In order to test this I added two more 12.5cm (4.7 inch) wide target zones around the original USTA target zones. I call these Medium and High risk zones, where the High risk zone abuts and includes the service lines. By running the selection again using these two extra zones we will see who is taking the risk and pushing their serve towards the lines more, the School Boys or the Big Boys?
PinpointingYourServeFig2

Figure 3. The percentage of serves that landed in the two additional High and Medium risk serve zones for each player. The width of each additional zone is 12.5cm (4.7 inches) (roughly twice the width of a tennis ball). In the second part of this blog we will see the spatial spread of serves across all target zones and all services boxes.

Figure 3 starts to tell a different story. By moving the target Federer was now clearly winning the most accurate server competition, landing 13 (14%) serves in the medium risk zone, and 18 (19%) in the high-risk zone. Murray’s success in these zones was a littler lower than Federer, with 10 (9%) for the medium risk zone, and 13 (12%) in the high-risk zone. School Boy A scored, 3 (4%) in the medium risk zone, and 5 (13%) in the high risk zone, while School Boy B scored, 2 (5%) and 7 (8%).

Clearly Federer was able to consistently pop more serves in the high-risk zones than any of the other three players. This would suggest that the Fed is arguably the most accurate server of the bunch? Most commentators of the game are unlikely to argue with that statement, but of course it depends on where the target is and where the players are aiming! School Boy A has every right to claim he is the most accurate server given he landed the highest proportion of his serves in the USTA target zones.

Some Further Ponderings

Given that each of the four USTA target zones in each service box are roughly 0.75m (2.46 ft) square I am surprised that the Big Boys are not landing a higher percentage of serves in these areas. No disrespect to the School Boys, they aren’t playing NCAA Level 1 tennis for no reason, but I expected the professional players to have a higher percentage of serves land in the target zones than the School Boys. I also expected Federer and Murray to land more serves in the higher risk zones. The results showed this was partly the case. Murray’s numbers in these zones are a little surprising given he swept aside Federer in straight sets on that day.

Perhaps at the highest level, simply aiming your serve at the USTA zones is not enough. Maybe the margin is too great. And in doing so you make life a little too easy for the returner?

So why do the School Boys have such a high percentage of serves in the USTA zones (compared to the Big Boys)? Is it because they serve with less speed and spin, therefore allowing them to slow things down and hit the ‘safe’ targets? Perhaps at this level, the players are taught to play the percentages? Perhaps their skill level forces them to do so?

The School Boys will no doubt develop their serving skills, and pop more serve speed and aggressive ‘kick’ on the ball as they mature. Being able to maintain that accuracy as they increase their serve speed and spin will be on ongoing player development challenge.

It is worth noting that each School Boy in the study served just over 50 times in their match, less than half that of Federer and Murray. Would they be able to maintain their high serve percentage into the USTA zones over a longer match where they may be required to serve 100+ serves? Would we see the same consistency, or could we expect it to see it drop off?

So what do these figures mean, if anything? What if I miss the USTA zones by a ball width or two? Am I still an accurate server? What if I’m only a little bit too short, or a little bit too central to the service box on my serve? Will I still win the same number of points if I’m a few centimeters or inches wide of the mark?

In part 2…

In the second part of this three-part blog I will endeavor to determine if there is a positive relationship between serve position, and outright success. I’ll explore if it’s possible to determine if the game of serving is really about a few centimeters or inches here and there? And in part 3 we will answer the most important question of all, who takes home the most free drinks!

Note: This study only looked at a very small sample of data from all players, so we need to be careful about making gross assumption based on the findings.

World’s Largest Tennis Map on Display in San Diego

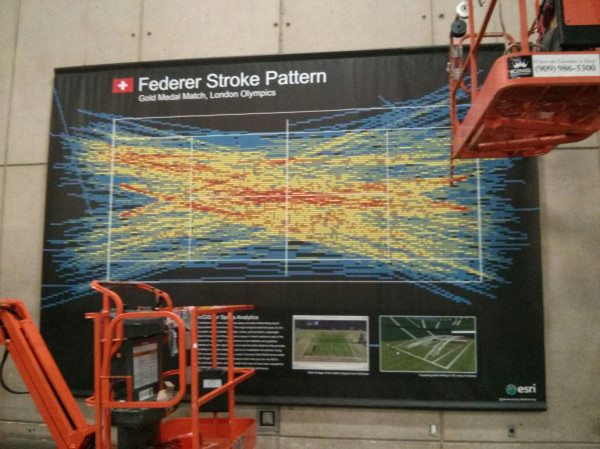
The world’s largest tennis map will be on display during Esri’s annual user conference this week in San Diego. The conference kicks off tomorrow and attracts around 15,000 geospatial enthusiasts from all around the world.World's largest tennis mapA colleague of mine, Ken Field (@kennenthfield) took this shot earlier today showing the map being put into place by two cranes! The map measures 5 m (16.2′ ft) wide x 3.7m (12.1ft) high. I put the map together to showcase unique, trendy and colourful maps made using GIS (Geographical Information Systems).

The map shows Roger Federer’s stroke pattern during the London Olympic Games against  Andy Murray last year.

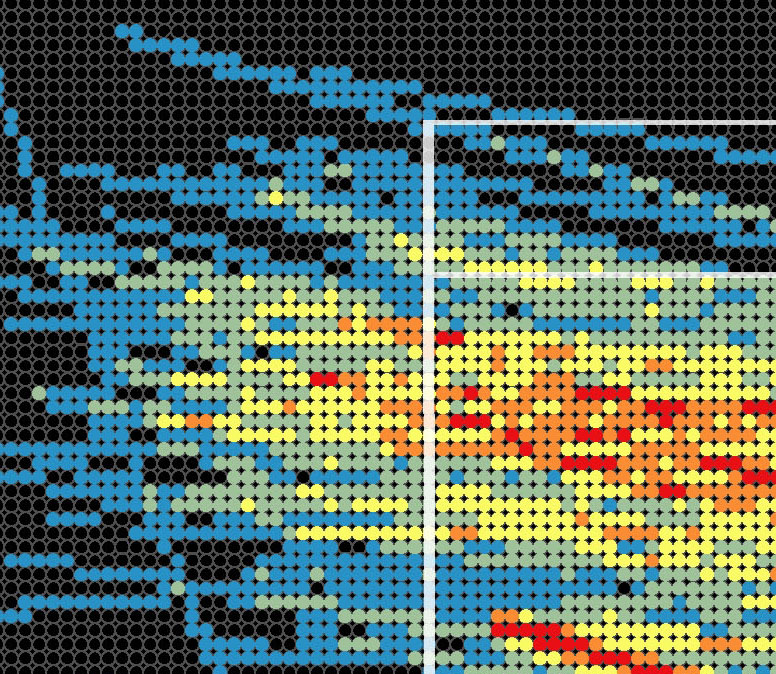
World's Largest Tennis MapA close up of the grid system used on the map.

The red areas on the map show where the ball passed through a section of the court 14-25 times. The light blue areas are where the ball passed through the court 1-2 times.

Federer map legend

The legend from the world’s largest tennis map.

You can hashtag the map on Twitter by using #federermap.

If you’re in San Diego this week and you’re a tennis fan you should stop by and see the artwork!

A 3D Lesson in Clutch Point Serving by S.Stakhovsky

The story from week one at Wimbledon was the exit of so many big name players either through defeat or injury. Rafael Nadal and Maria Sharapova were both forced to pack their bags and head home much earlier than they would have liked. As did the reigning Champion Roger Federer.

Sergiy Stakhovsky played out of his skin against the swiss mystro putting on a clinic of clutch point serving throughout the match. Sergiy was able to back-up his serving with sublime touch at the net. Sergiy won the match 6-7, 7-6, 7-5, 7-6 in just under 3 hours.

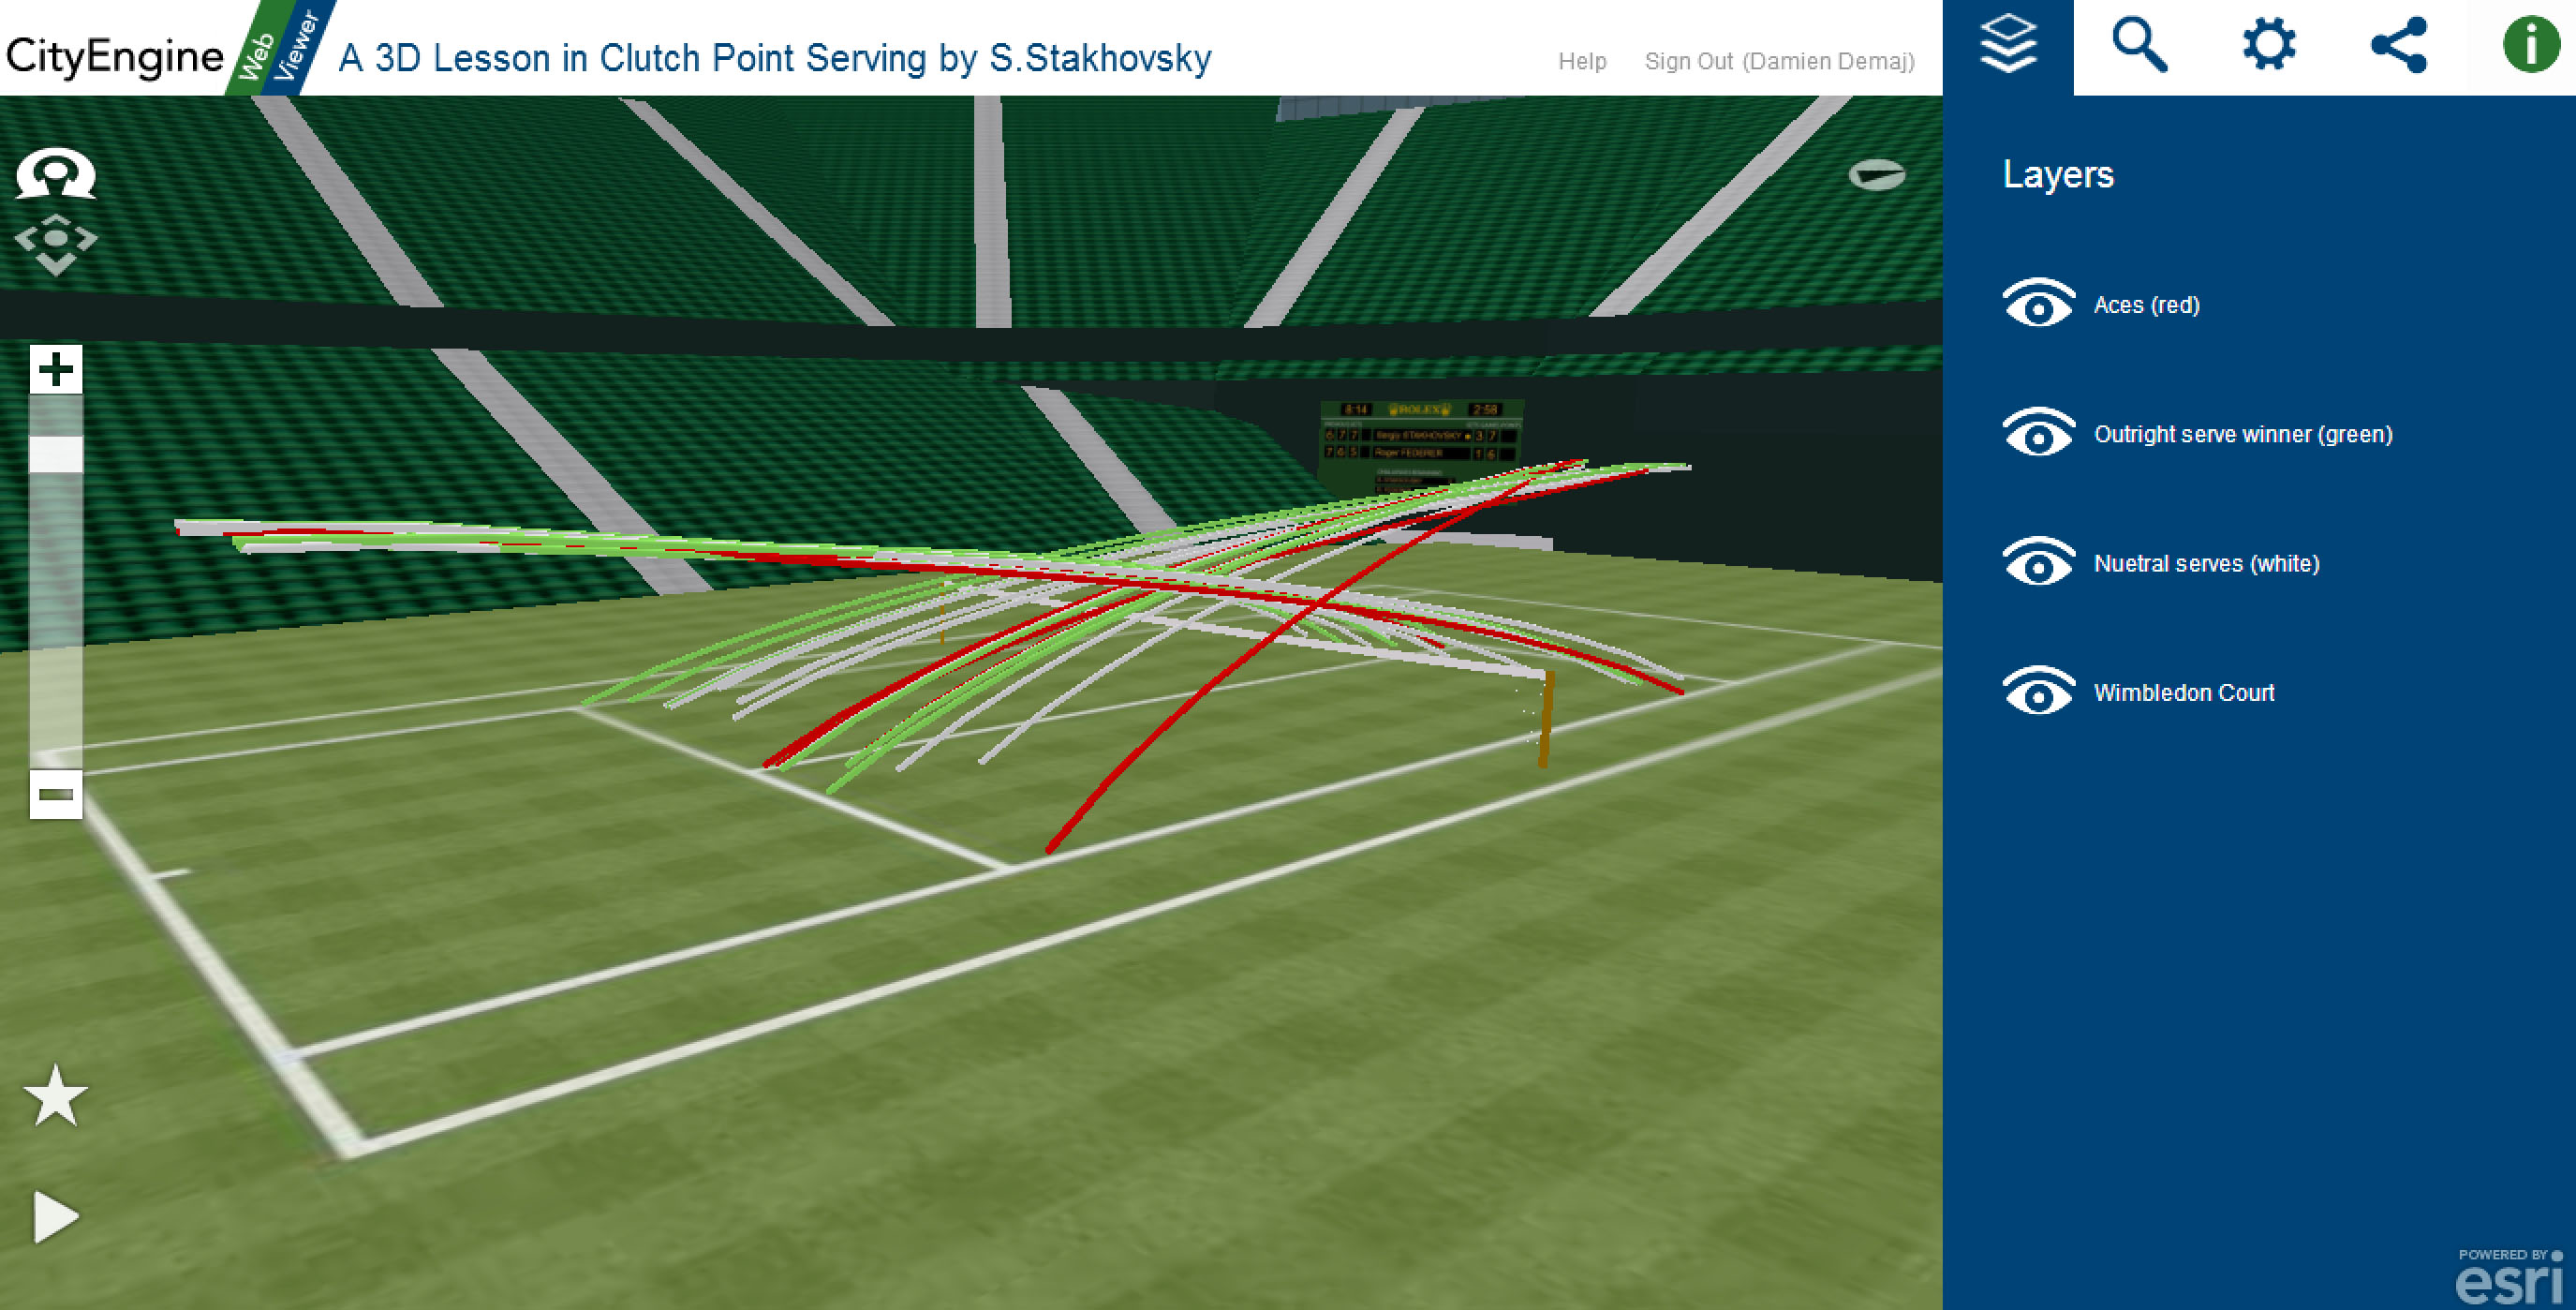
To celebrate Sergiy’s win I’ve prepared a unique 3D tennis visualization that invites you to step onto Centre Court at Wimbledon and see how Sergiy bundled out the 7 time Wimbledon Champion Roger Federer in the 2nd round.

3D Interactive Tennis Visualization

Click here to open the 3D application. (Best viewed in Google Chrome on a desktop machine). 

Sergiy served almost exclusively to Federer’s backhand at important points (37 out of 43, 86%). On 4 occasions Sergiy went to Federer’s forehand side. Of those 4 serves he aced him twice! And in the duece court he went straight at Federer’s body two times, having success half of those times.

When Federer was able to return Sergiy’s serve into play (as shown by the white lines on the map), he won 9 of 22 points (40%), while Sergiy won 13 of 22 (59%).

The visualisation only includes serves at 15-30, 30-30, 15-40, 30-40 ans 40-Ad, and all of Sergiy’s serves during each tiebreak.

The red lines on the map are aces. The green lines are where Sergiy forced Federer into a direct error on his return of serve. The white lines are serves that Federer put back in play.

The 3D map is completely interactive. Click on each line and retrieve information about when the serve was made and what the score was.

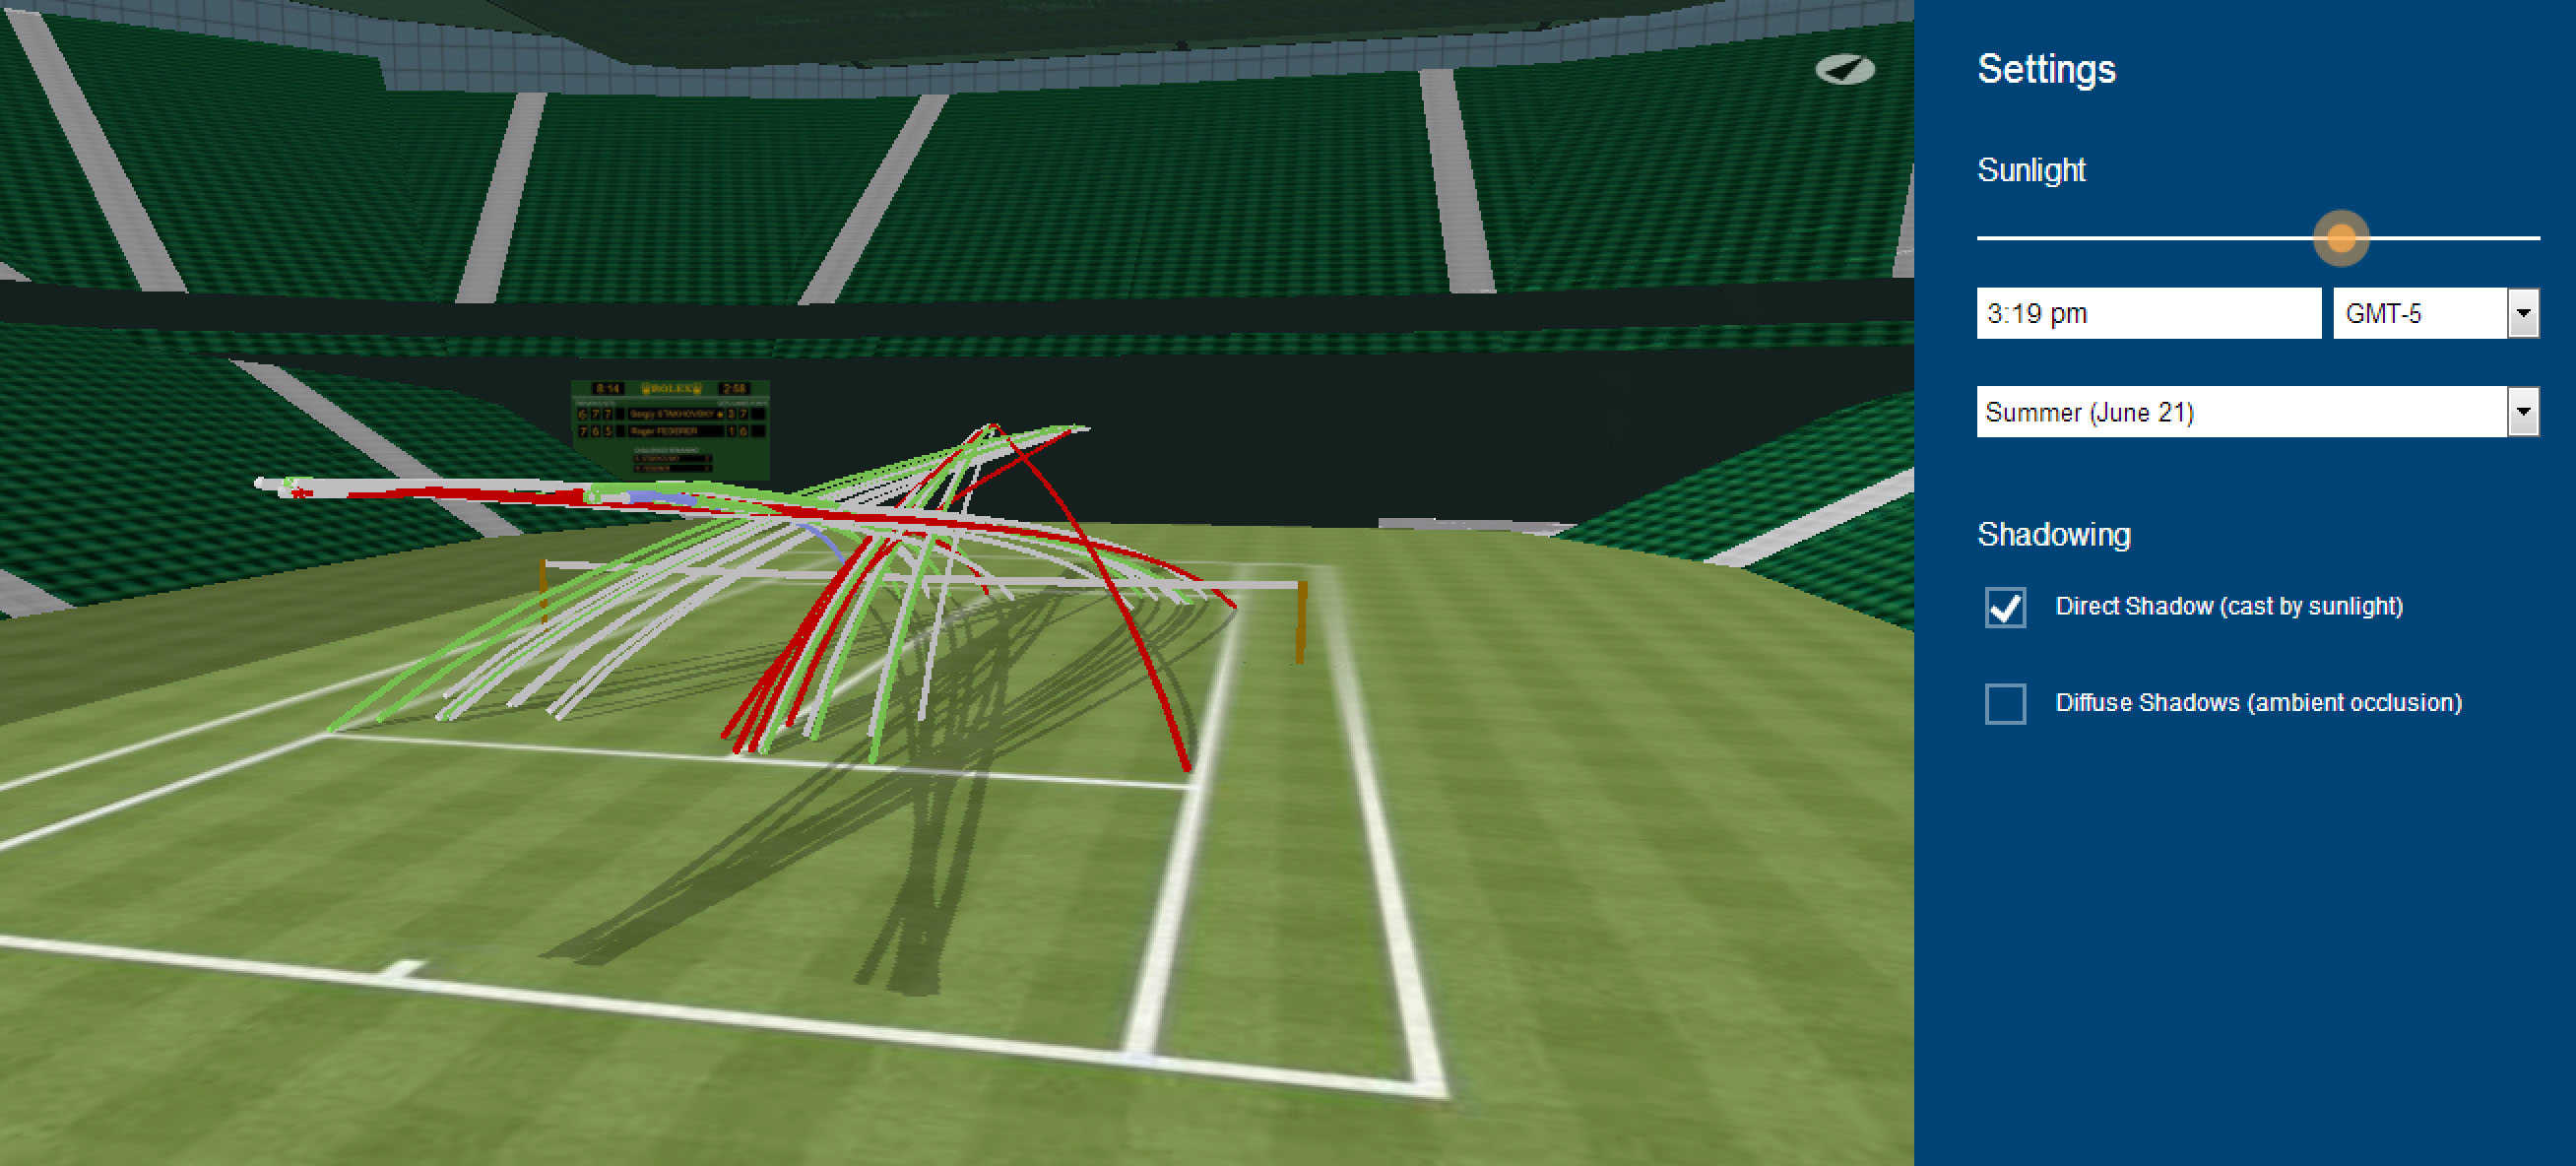
You can even add a little more realism to the scene by adding shadows to the court.

3D Tennis Visualization Shadows

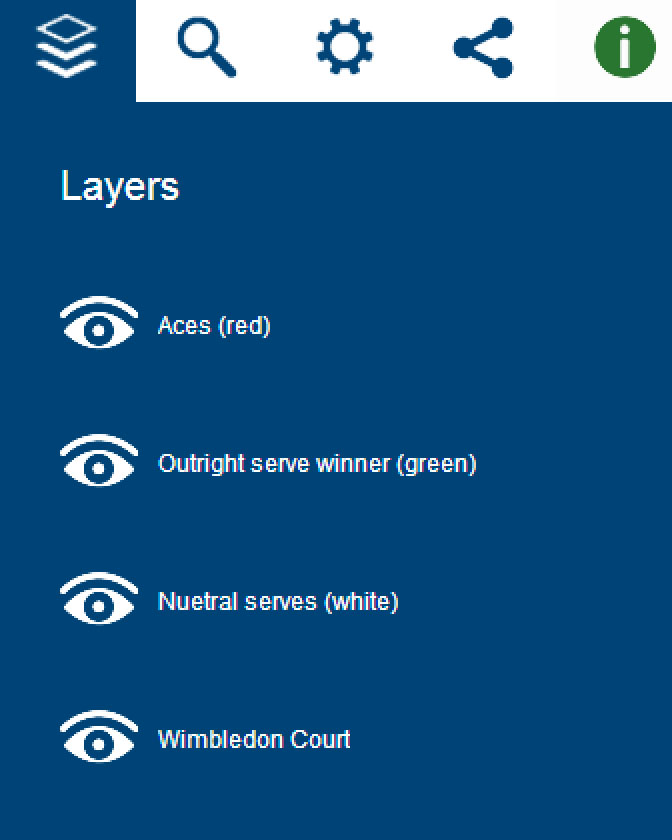
Use the eye icons in the menu below to turn on/off layers in your scene.

3D Tennis Visualization Menu

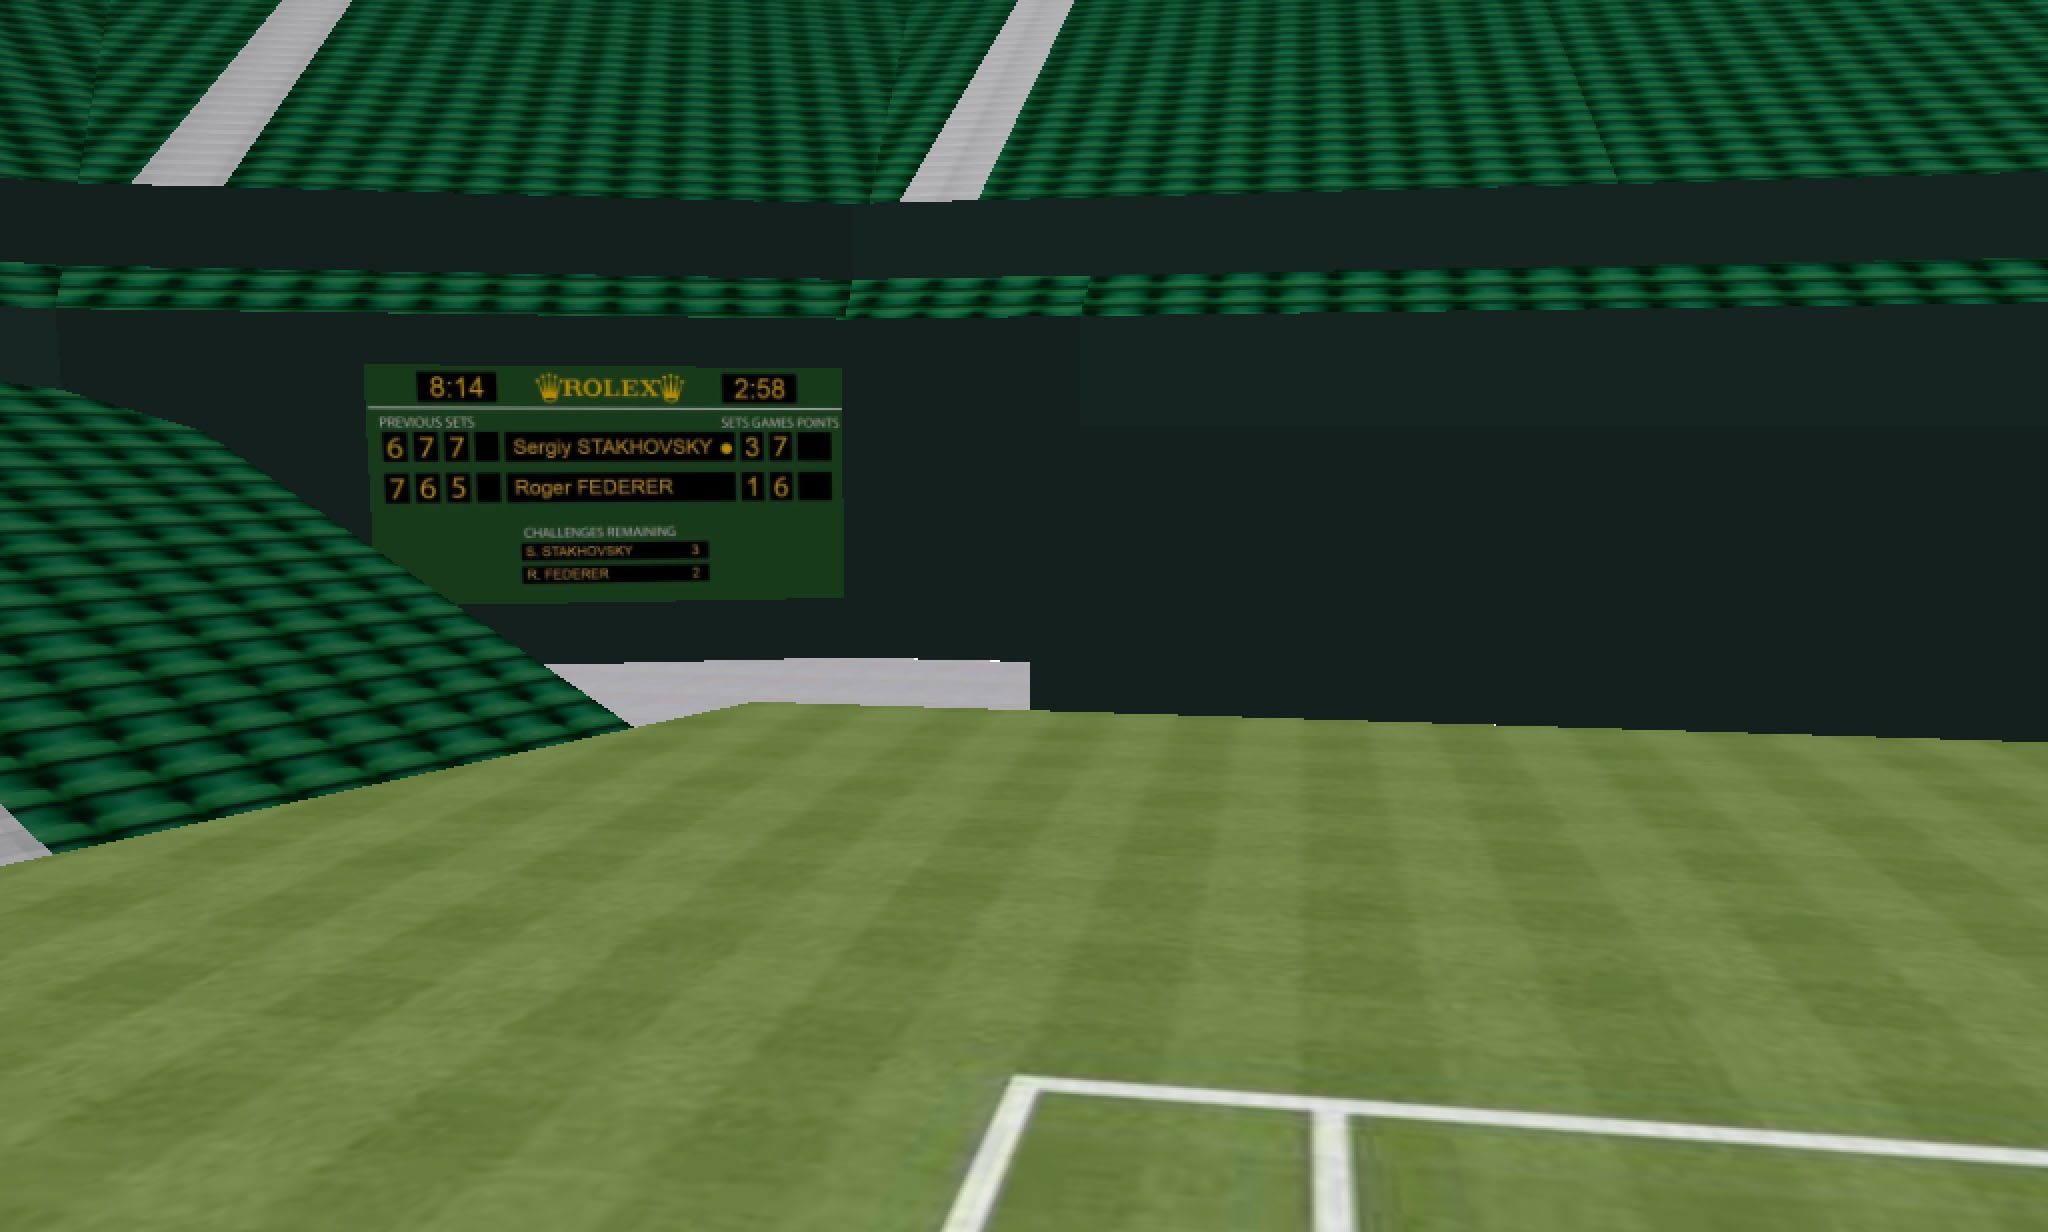
To record the historic moment I have added the final score of the match, the match duration and the time the match was completed (local time) to the scoreboard!

3D Tennis Visualization Scoreboard

Spatial serve variation is thought to be a good indicator of ones serve success. However as you can see in the visualization Sergiy was not afraid of becoming predictable. I guess when you are having so much success doing one thing, why change it up right?

I hope you enjoy this immersive 3D tennis experience!

The above scene uses new HTML 5 WebGL technology, so there is no need to install a plugin to view the scenes. For more information about the City Engine viewer click here.

“OK Glass, show me Tennis Analytics”. How Google Glass will revolutionize the way we see tennis.

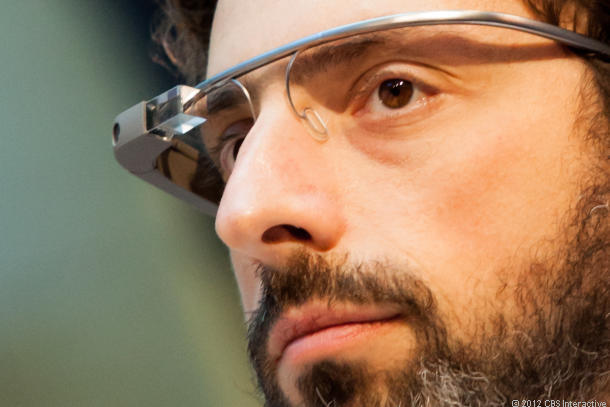
Early in 2012, the tech world was buzzing with the news that Google was about to release a wearable augmented reality device. Enter Google Glass.  Google Glass puts augmented reality right in front of your eyes, literally!

Sergey-Brin-Wearing-Google-GlassSergey Brin, co-founder of Google models Google Glass earlier this year.

There has been plenty of hype surrounding the product since it’s preview early last year, and we have seen examples how Google Glass can be used to take a picture, record a video, or get directions.

But what else might one do with Google Glass?

To activate Google Glass, you start by saying “OK Glass”. Then you ask Google Glass to show, do, or tell you something. So let’s give it a try:

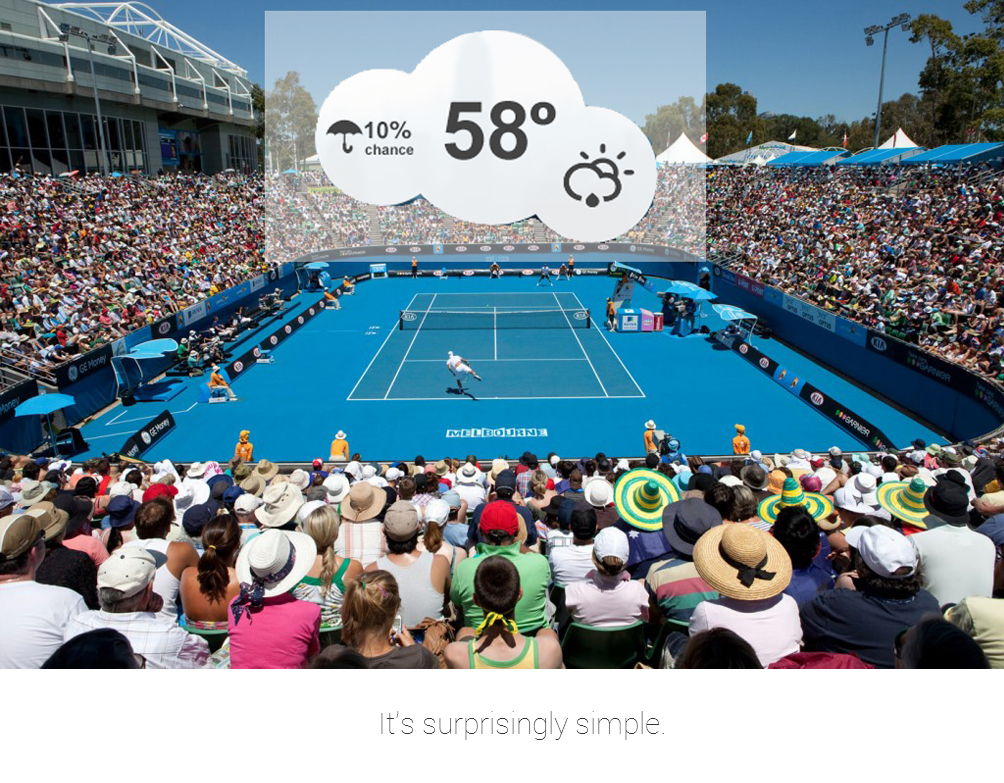
Lets start with a simple question. “OK Glass, show me the weather forecast at the Australian Open today”

Google Glass Australian Open

Imagine sitting courtside at the Australian Open and wondering what the weather is going to be like for the afternoons play. Up pops the current weather conditions. It’s as simple as that.

Google Glass has the ability to overlay all kinds of information in your field of view. So let’s try this:

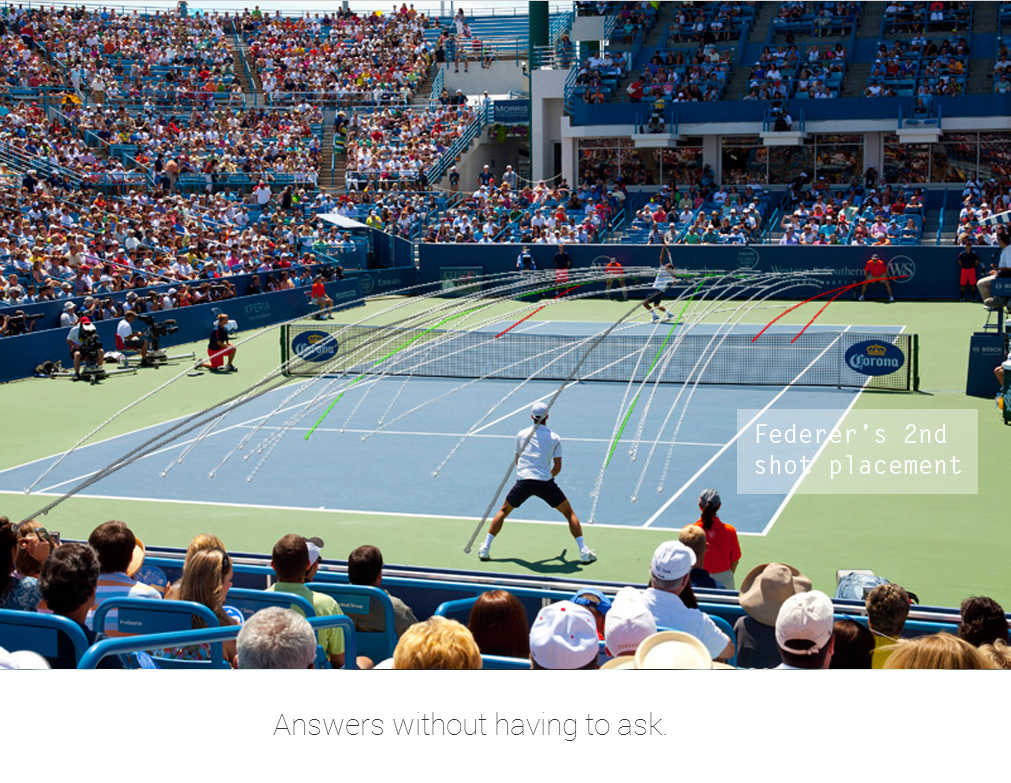
“OK Glass, show me Federer’s second shot placement”

Google Glass Federer

Imagine sitting courtside at the Cincinnati Open and wondering where Federer had previously played his second shot after Novak’s return of serve. Bam, up pops the trajectory lines of Federer’s second shot to show you where he’s likely to hit his next shot. Excited yet? Let’s try one more example.

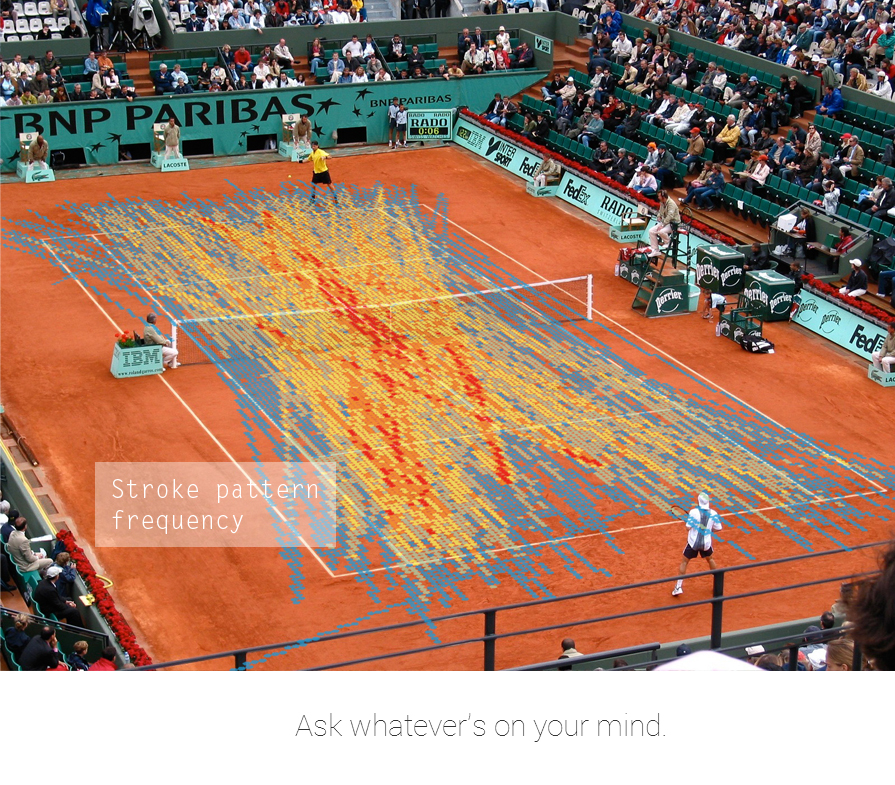
“OK Glass, show me a stroke pattern heat map”

French Open Heat Map

Imagine sitting in the stands at court Philippe Chatrier and wondering where this player is going to hit his forehand? Google Glass immediately overlays the stroke pattern right onto the court so you can see where his shots have been passing on the court. Wow!

These images are a few quick examples that I put together to show you the potential of Google Glass in tennis. Google Glass will enhance our viewing experience of tennis (and all sports) by 10 fold! Sitting court side, we will be able to control when we see the stats, what stats we see and for how long. Whether it is seeing a live heat map, or 3D ball trajectory the potential is endless.

Of course, if tennis analytics isn’t your thing you may find Google Glass useful to find a friend in the crowd, or to video a point and share it on Facebook. You might even ask Google Glass for directions to Arthur Ashe Stadium!

The real time visualization of sports statistics and Google Glass are a match made in heaven. Let’s hope the ATP, WTA, and ITF fast track the delivery of real time tennis analytics to everyone so when Google Glass goes live, the game and our eyes will be ready!

To find out more about Google Glass visit their homepage.

Image Credits:

Sergy Brin wearing Google Glass: Copyright CBS Interactive

Australian Open: http://madamebonbon.com.au/blog/archives/7968

Roland Garros pic: http://lewebpedagogique.com/alaricenglishspeakers/the-tennis-and-roland-garros/

Cincy Tennis: https://shop.cincytennis.com/SeatViewer.aspx